I’ve had a couple of issues with brown-outs recently which have interrupted my Proxmox server, and stopped my connected disks from coming back up cleanly (yes, I’m working on that separately!) but it’s left me in a state where several of my containers and virtual machines on the cluster are down.
It’s possible to point-and-click your way around this, but far easier to script it!
A failed state may look like this:
root@proxmox1:~# ha-manager status
quorum OK
master proxmox2 (active, Fri Mar 22 10:40:49 2024)
lrm proxmox1 (active, Fri Mar 22 10:40:52 2024)
lrm proxmox2 (active, Fri Mar 22 10:40:54 2024)
service ct:101 (proxmox1, error)
service ct:102 (proxmox2, error)
service ct:103 (proxmox2, error)
service ct:104 (proxmox1, error)
service ct:105 (proxmox1, error)
service ct:106 (proxmox2, error)
service ct:107 (proxmox2, error)
service ct:108 (proxmox1, error)
service ct:109 (proxmox2, error)
service vm:100 (proxmox2, error)
Once you’ve fixed your issue, you can do this on each node:
for worker in $(ha-manager status | grep "($(hostnamectl hostname), error)" | cut -d\  -f2)
do
  echo "Disabling $worker"
  ha-manager set $worker --state disabled
  until ha-manager status | grep "$worker" | grep -q disabled ; do sleep 1 ; done
  echo "Restarting $worker"
  ha-manager set $worker --state started
  until ha-manager status | grep "$worker" | grep -q started ; do sleep 1 ; done
done
Note that this hasn’t been tested, but a scan over it with those nodes working suggests it should. I guess I’ll be updating this the next time I get a brown-out!
I have a small server running Docker for services at home. There are several services which will want to use HTTP, but I can’t have them all sharing the same port without a reverse proxy to manage how to route the traffic to the containers!
This is my guide to how I got Traefik set up to serve HTTP and HTTPS traffic.
The existing setup for one service
Currently, I have phpIPAM which has the following docker-compose.yml file:
The moment I want to bind another service to TCP/80, I get an error because we’ve already used TCP/80 for phpIPAM. Enter Traefik. Let’s stop the docker container with docker compose down and build our Traefik setup.
Traefik Setup
I always store my docker compose files in /opt/docker/<servicename>, so let’s create a directory for traefik; sudo mkdir -p /opt/docker/traefik
The (“dynamic”) configuration file
Next we need to create a configuration file called traefik.yaml
# Ensure all logs are sent to stdout for `docker compose logs`
accessLog: {}
log: {}

# Enable docker provider but don't switch it on by default
providers:
  docker:
    exposedByDefault: false
    # Select this as the docker network to connect from traefik to containers
    # This is defined in the docker-compose.yaml file
    network: web

# Enable the API and Dashboard on TCP/8080
api:
  dashboard: true
  insecure: true
  debug: true

# Listen on both HTTP and HTTPS
entryPoints:
  http:
    address: ":80"
    http: {}
  https:
    address: ":443"
    http:
      tls: {}
With the configuration file like this, we’ll serve HTTPS traffic with a self-signed TLS certificate on TCP/443 and plain HTTP on TCP/80. We have a dashboard on TCP/8080 served over HTTP, so make sure you don’t expose *that* to the public internet!
The Docker-Compose File
Next we need the docker-compose file for Traefik, so let’s create docker-compose.yaml
There are a few parts here which aren’t spelled out on the Traefik quickstart! Firstly, if you don’t define a network, it’ll create one using the docker-compose file path, so probably traefik_traefik or traefik_default, which is not what we want! So, we’ll create one called “web” (but you can call it whatever you want. On other deployments, I’ve used the name “traefik” but I found it tedious to remember how to spell that each time). This network needs to be “attachable” so that other containers can use it later.
You then attach that network to the traefik service, and expose the ports we need (80, 443 and 8080).
And then start the container with docker compose up -d
alpine-docker:/opt/docker/traefik# docker compose up -d
[+] Running 2/2
 ✔ Network web                  Created   0.2s
 ✔ Container traefik-traefik-1  Started   1.7s
alpine-docker:/opt/docker/traefik#
Adding Traefik to phpIPAM
Going back to phpIPAM, So that Traefik can reach the containers, and so that the container can reach it’s database, we need two network statements now; the first is the “external” network for the traefik connection which we called “web“. The second is the inter-container network so that the “web” service can reach the “db” service, and so that the “cron” service can reach the “db” service. So we need to add that to the start of /opt/docker/phpipam/docker-compose.yaml, like this;
We then need to add both networks that to the “web” container, like this:
services:
  web:
    image: phpipam/phpipam-www:latest
    networks:
      - ipam
      - web
# ...... and the rest of the config
Remove the “ports” block and replace it with an expose block like this:
services:
  web:
# ...... The rest of the config for this service
    ## Don't bind to port 80 - we use traefik now
    # ports:
    #   - "80:80"
    ## Do expose port 80 for Traefik to use
    expose:
      - 80
# ...... and the rest of the config
And just the inter-container network to the “cron” and “db” containers, like this:
  cron:
    image: phpipam/phpipam-cron:latest
    networks:
      - ipam
# ...... and the rest of the config

  db:
    image: mariadb:latest
    networks:
      - ipam
# ...... and the rest of the config
There’s one other set of changes we need to make in the “web” service, which are to enable Traefik to know that this is a container to look at, and to work out what traffic to send to it, and that’s to add labels, like this:
services:
  web:
# ...... The rest of the config for this service
    labels:
      - traefik.enable=true
      - traefik.http.routers.phpipam.rule=Host(`phpipam.homenet`)
# ...... and the rest of the config
Right, now we run docker compose up -d
alpine-docker:/opt/docker/phpipam# docker compose up -d
[+] Running 4/4
 ✔ Network ipam              Created   0.4s
 ✔ Container phpipam-db-1    Started   1.4s
 ✔ Container phpipam-cron-1  Started   2.1s
 ✔ Container phpipam-web-1   Started   2.6s
alpine-docker:/opt/docker/phpipam#
If you notice, this doesn’t show to the web network being created (because it was already created by Traefik) but does bring up the container.
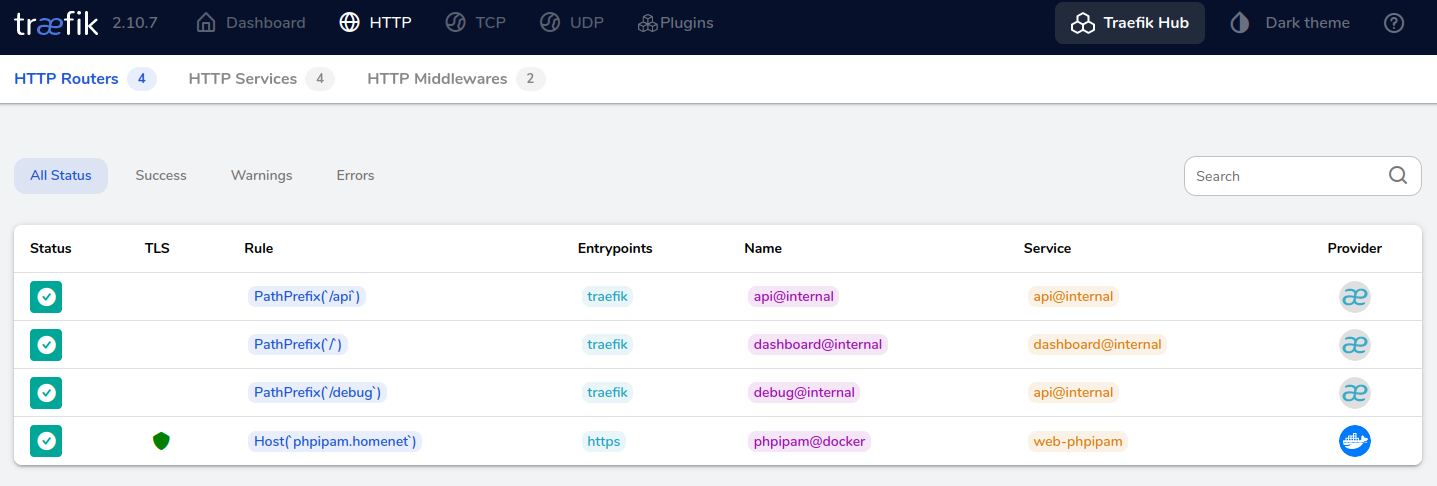
Checking to make sure it’s working
If we head to the Traefik dashboard (http://your-docker-server:8080) you’ll see the phpipam service identified there… yey!
Better TLS with Lets Encrypt
So, at home I actually have a DNS suffix that is a real DNS name. For the sake of the rest of this documentation, assume it’s homenet.sprig.gs (but it isn’t 😁).
This DNS space is hosted by Digital Ocean, so I can use a DNS Challenge with Lets Encrypt to provide hostnames which are not publically accessible. If you’re hosting with someone else, then that’s probably also available – check the Traefik documentation for your specific variables. The table on that page (as of 2023-12-30) shows the environment variables you need to pass to Traefik to get LetsEncrypt working.
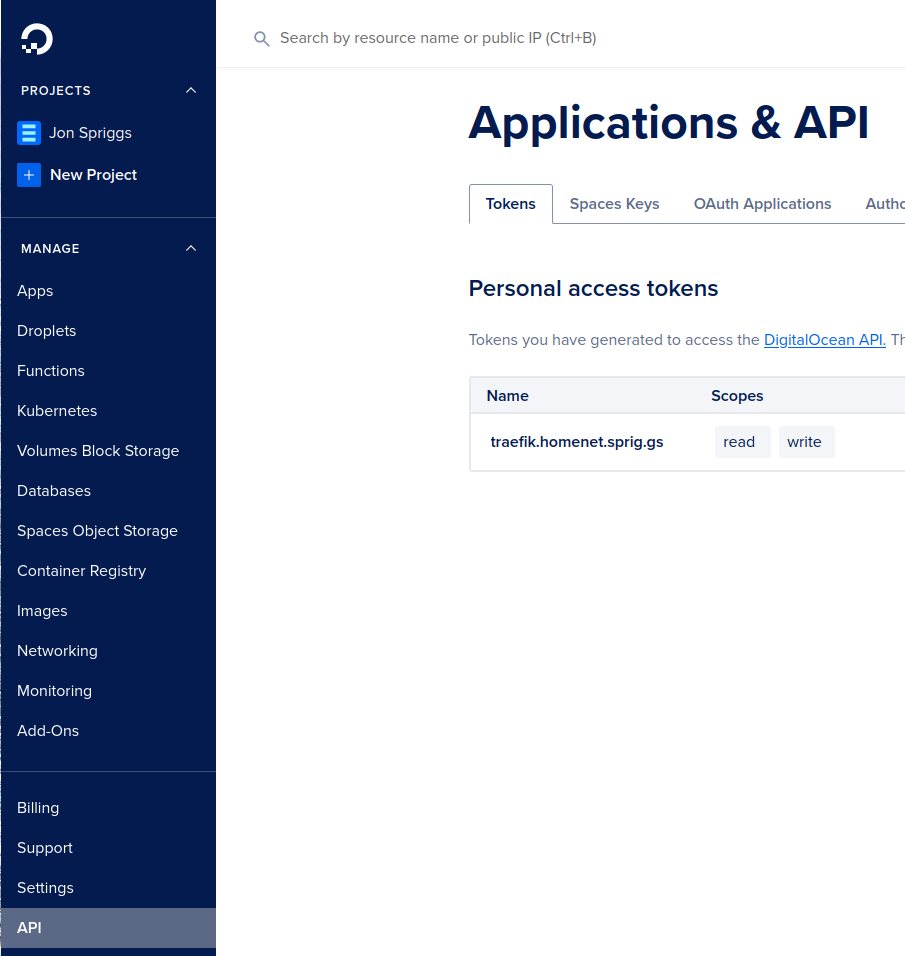
As you can see here, I just need to add the value DO_AUTH_TOKEN, which is an API key. I went to the Digital Ocean console, and navigated to the API panel, and added a new “Personal Access Token”, like this:
Notice that the API key needed to provide both “Read” and “Write” capabilities, and has been given a name so I can clearly see it’s purpose.
Changing the traefik docker-compose.yaml file
In /opt/docker/traefik/docker-compose.yaml we need to add that new environment variable; DO_AUTH_TOKEN, like this:
services:
  traefik:
# ...... The rest of the config for this service
    environment:
      DO_AUTH_TOKEN: dop_v1_decafbad1234567890abcdef....1234567890
# ...... and the rest of the config
Changing the traefik.yaml file
In /opt/docker/traefik/traefik.yaml we need to tell it to use Let’s Encrypt. Add this block to the end of the file:
Obviously change the email address to a valid one for you! I hit a few issues with the value specified in the documentation for delayBeforeCheck, as their value of “0” wasn’t long enough for the DNS value to be propogated around the network – 1 minute is enough though!
I also had to add the resolvers, as my local network has a caching DNS server, so I’d never have seen the updates! You may be able to remove both those values from your files.
Now you’ve made all the changes to the Traefik service, restart it with docker compose down ; docker compose up -d
Changing the services to use Lets Encrypt
We need to add one final label to the /opt/docker/phpipam/docker-compose.yaml file, which is this one:
services:
  web:
# ...... The rest of the config for this service
    labels:
      - traefik.http.routers.phpipam.tls.certresolver=letsencrypt
# ...... and the rest of the config
Also, update your .rule=Host(`hostname`) to use the actual DNS name you want to be able to use, then restart the docker container.
phpIPAM doesn’t like trusting proxies, unless explicitly told to, so I also had add an environment variable IPAM_TRUST_X_FORWARDED=true to the /opt/docker/phpipam/docker-compose.yaml file too, because phpIPAM tried to write the HTTP scheme for any links which came up, based on what protocol it thought it was running – not what the proxy was telling it it was being accessed as!
Debugging any issues
If you have it all setup as per the above, and it isn’t working, go into /opt/docker/traefik/traefik.yaml and change the stanza which says log: {} to:
log:
  level: DEBUG
Be aware though, this adds a LOT to your logs! (But you won’t see why your ACME requests have failed without it). Change it back to log: {} once you have it working again.
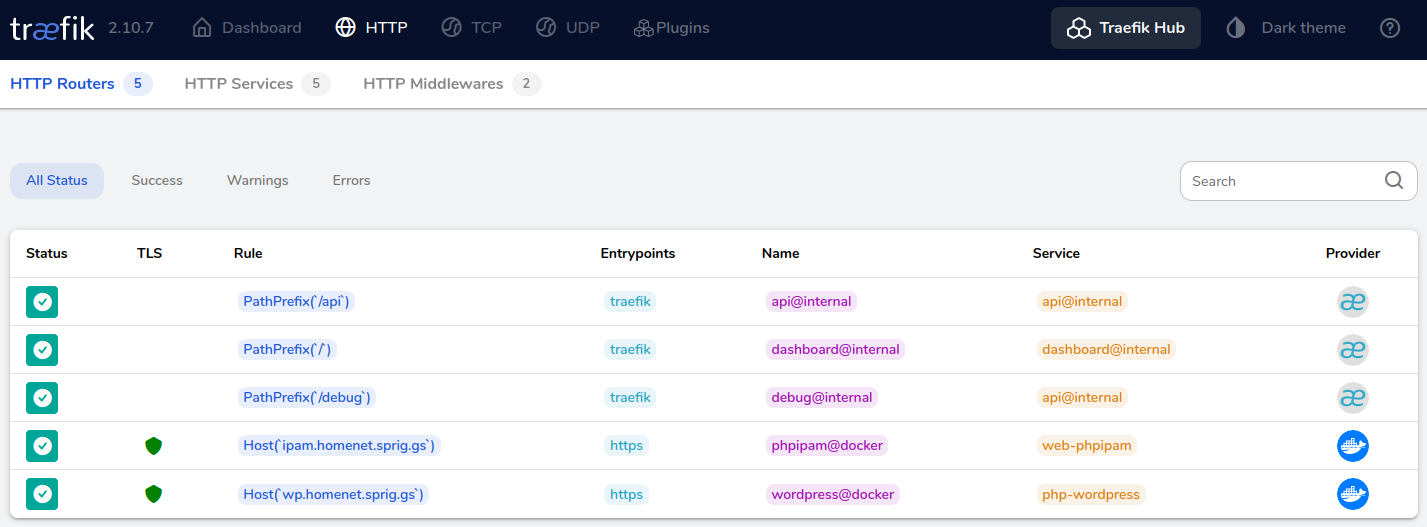
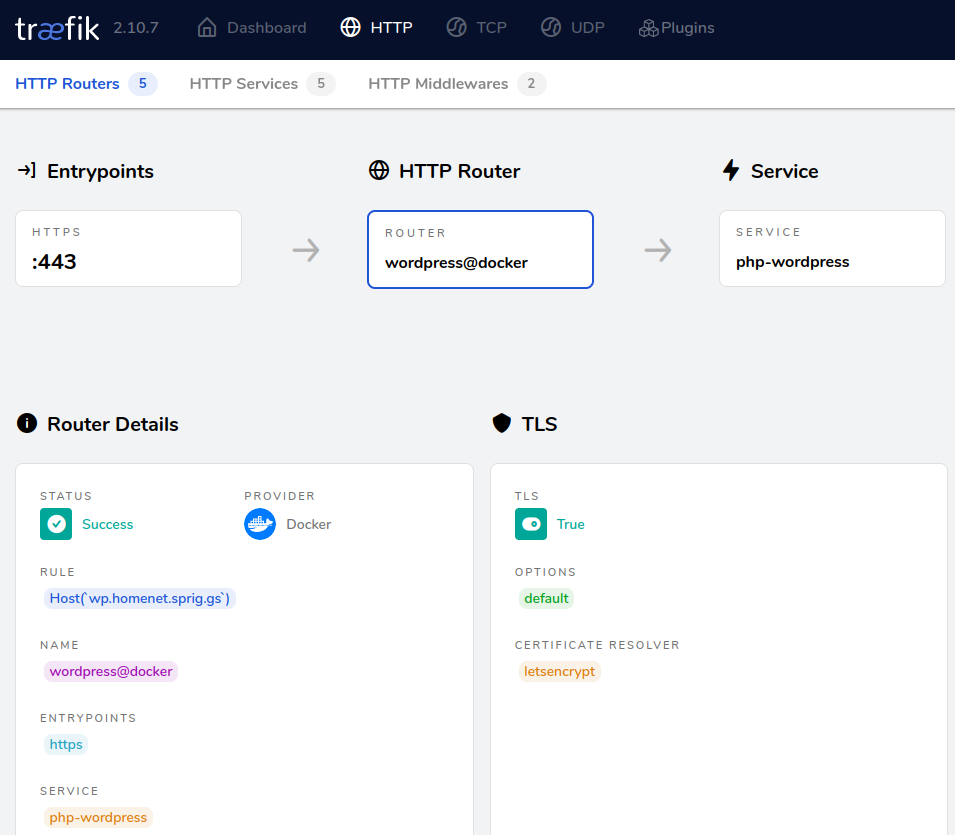
Adding your next service
I now want to add that second service to my home network – WordPress. Here’s /opt/docker/wordpress/docker-compose.yaml for that service;
alpine-docker:/opt/docker/wordpress# docker compose up -d
[+] Running 3/3
 ✔ Network wordpress              Created   0.2s
 ✔ Container wordpress-mariadb-1  Started   3.0s
 ✔ Container wordpress-php-1      Started   3.8s
alpine-docker:/opt/docker/wordpress#
Tada!
One final comment – I never did work out how to make connections forceably upgrade from HTTP to HTTPS, so instead, I shut down port 80 in Traefik, and instead run this container.
I love the tee command – it captures stdout [1] and puts it in a file, while then returning that output to stdout for the next process in a pipe to consume, for example:
$ ls -l | tee /tmp/output
total 1
xrwxrwxrw 1 jonspriggs jonspriggs 0 Jul 27 11:16 build.sh
$ cat /tmp/output
total 1
xrwxrwxrw 1 jonspriggs jonspriggs 0 Jul 27 11:16 build.sh
But wait, why is that useful? Well, in a script, you don’t always want to see the content scrolling past, but in the case of a problem, you might need to catch up with the logs afterwards. Alternatively, you might do something like this:
if some_process | tee /tmp/output | grep -q "some text"
then
  echo "Found 'some text' - full output:"
  cat /tmp/output
fi
This works great for stdout but what about stderr [2]? In this case you could just do:
some_process 2>&1 | tee /tmp/output
But that mashes all of stdout and stderr into the same blob.
In my case, I want to capture all the output (stdout and stderr) of a given process into a file. Only stdout is forwarded to the next process, but I still wanted to have the option to see stderr as well during processing. Enter process substitution.
With this, I run capture_out step-1 do_a_thing and then in /tmp/tmp.sometext/step-1/stdout and /tmp/tmp.sometext/step-1/stderr are the full outputs I need… but wait, I can also do:
if capture_out has_an_error something-wrong | capture_out handler check_output
then
  echo "It all went great"
else
  echo "Process failure"
  echo "--Initial process"
  # Use wc -c to check the number of characters in the file
  if [ -e "${TEMP_DATA_PATH}/has_an_error/stdout"] && [ 0 -ne "$(wc -c "${TEMP_DATA_PATH}/has_an_error/stdout")" ]
  then
    echo "----stdout:"
    cat "${TEMP_DATA_PATH}/has_an_error/stdout"
  fi
  if [ -e "${TEMP_DATA_PATH}/has_an_error/stderr"] && [ 0 -ne "$(wc -c "${TEMP_DATA_PATH}/has_an_error/stderr")" ]
  then
    echo "----stderr:"
    cat "${TEMP_DATA_PATH}/has_an_error/stderr"
  fi
  echo "--Second stage"
  if [ -e "${TEMP_DATA_PATH}/handler/stdout"] && [ 0 -ne "$(wc -c "${TEMP_DATA_PATH}/handler/stdout")" ]
  then
    echo "----stdout:"
    cat "${TEMP_DATA_PATH}/handler/stdout"
  fi
  if [ -e "${TEMP_DATA_PATH}/handler/stderr"] && [ 0 -ne "$(wc -c "${TEMP_DATA_PATH}/handler/stderr")" ]
  then
    echo "----stderr:"
    cat "${TEMP_DATA_PATH}/handler/stderr"
  fi
fi
This has become part of my normal toolkit now for logging processes. Thanks bash!
Also, thanks to ChatGPT for helping me find this structure that I’d seen before, but couldn’t remember how to do it! (it almost got it right too! Remember kids, don’t *trust* what ChatGPT gives you, use it as a research starting point, test *that* against your own knowledge, test *that* against your environment and test *that* against expected error cases too! Copy & Paste is not the best idea with AI generated code!)
Footnotes
[1] stdout is the name of the normal output text we see in a shell, it’s also sometimes referred to as “file descriptor 1” or “fd1”. You can also output to &1 with >&1 which means “send to fd1”
[2] stderr is the name of the output in a shell when an error occurs. It isn’t caught by things like some_process > /dev/null which makes it useful when you don’t want to see output, just errors. Like stdout, it’s also referred to as “file descriptor 2” or “fd2” and you can output to &2 with >&2 if you want to send stdout to stderr.
In my current project I am often working with Infrastructure as Code (IoC) in the form of Terraform and Terragrunt files. Before I joined the team a decision was made to use SOPS from Mozilla, and this is encrypted with an AWS KMS key. You can only access specific roles using the SAML2AWS credentials, and I won’t be explaining how to set that part up, as that is highly dependant on your SAML provider.
While much of our environment uses AWS, we do have a small presence hosted on-prem, using a hypervisor service. I’ll demonstrate this with Proxmox, as this is something that I also use personally :)
Firstly, make sure you have all of the above tools installed! For one stage, you’ll also require yq to be installed. Ensure you’ve got your shell hook setup for direnv as we’ll need this later too.
Late edit 2023-07-03: There was a bug in v0.22.0 of the terraform which didn’t recognise the environment variables prefixed PROXMOX_VE_ – a workaround by using TF_VAR_PROXMOX_VE and a variable "PROXMOX_VE_" {} block in the Terraform code was put in place for the inital publication of this post. The bug was fixed in 0.23.0 which this post now uses instead, and so as a result the use of TF_VAR_ prefixed variables was removed too.
Set up AWS Vault
AWS KMS
AWS Key Management Service (KMS) is a service which generates and makes available encryption keys, backed by the AWS service. There are *lots* of ways to cut that particular cake, but let’s do this a quick and easy way… terraform
So far, so good… but wait, you’ve authenticated to your SAML access to AWS. Let’s close that shell, and go back in again
$ cd /path/to/demo
direnv: loading /path/to/demo/.envrc
direnv: using sops
$
Ah, now we don’t have our values exported. That’s what we wanted!
What now?!
Configuring the details of the proxmox cluster
We have our .envrc file which provides our credentials (let’s pretend we’re using a shared set of credentials across all the boxes), but now we need to setup access to each of the boxes.
Let’s make our two cluster directories;
mkdir cluster_01
mkdir cluster_02
And in each of these clusters, we need to put an .envrc file with the right IP address in. This needs to check up the tree for any credentials we may have already loaded:
source_env "$(find_up ../.envrc)"
export PROXMOX_VE_ENDPOINT="https://192.0.2.1:8006" # Documentation IP address for the first cluster - change for the second cluster.
The first line works up the tree, looking for a parent .envrc file to inject, and then, with the second line, adds the Proxmox API endpoint to the end of that chain. When we run direnv allow (having logged back into our saml2aws session), we get this:
Then in the cluster_01 directory, create a directory for the code you want to run (e.g. create a VLAN might be called “VLANs/30/“) and put in it this terragrunt.hcl
This assumes you have a terraform directory called terraform-module-network/vlan in a particular place in your tree or even better, a module in your git repo, which uses the input values you’ve provided.
That double slash in the source line isn’t a typo either – this is the point in that tree that Terragrunt will copy into the directory to run terraform from too.
A quick note about includes and provider blocks
The other key thing is that the “include” block loads the values from the first matching terragrunt.hcl file in the parent directories, which in this case is the one which defined the providers block. You can’t include multiple different parent files, and you can’t have multiple generate blocks either.
Running it all together!
Now we have all our depending files, let’s run it!
user@host:~$ cd test
direnv: loading ~/test/.envrc
direnv: using sops
user@host:~/test$ saml2aws login --skip-prompt --quiet ; saml2aws exec -- bash
direnv: loading ~/test/.envrc
direnv: using sops
direnv: export +PROXMOX_VE_USERNAME +PROXMOX_VE_PASSWORD
user@host:~/test$ cd cluster_01/VLANs/30
direnv: loading ~/test/cluster_01/.envrc
direnv: loading ~/test/.envrc
direnv: using sops
direnv: export +PROXMOX_VE_ENDPOINT +PROXMOX_VE_USERNAME +PROXMOX_VE_PASSWORD
user@host:~/test/cluster_01/VLANs/30$ terragrunt apply
data.proxmox_virtual_environment_nodes.available_nodes: Reading...
data.proxmox_virtual_environment_nodes.available_nodes: Read complete after 0s [id=nodes]

Terraform used the selected providers to generate the following execution
plan. Resource actions are indicated with the following symbols:
  + create

Terraform will perform the following actions:

  # proxmox_virtual_environment_network_linux_bridge.this[0] will be created
  + resource "proxmox_virtual_environment_network_linux_bridge" "this" {
      + autostart  = true
      + comment    = "VLAN30"
      + id         = (known after apply)
      + mtu        = (known after apply)
      + name       = "vmbr30"
      + node_name  = "proxmox01"
      + ports      = [
          + "enp3s0.30",
        ]
      + vlan_aware = (known after apply)
    }

Plan: 1 to add, 0 to change, 0 to destroy.

Do you want to perform these actions?
  Terraform will perform the actions described above.
  Only 'yes' will be accepted to approve.

  Enter a value: yes
proxmox_virtual_environment_network_linux_bridge.this[0]: Creating...
proxmox_virtual_environment_network_linux_bridge.this[0]: Creation complete after 2s [id=proxmox01:vmbr30]
user@host:~/test/cluster_01/VLANs/30$
I’m working on another toy project to understand a piece of software a little better, and to make it work, I needed to install dnsmasq inside an Ubuntu-based virtual machine. The problem with this is that Ubuntu already runs systemd-resolved to perform DNS lookups, and Debian likes to start server services as soon as it’s installed them. So how do we work around this? Well, actually, it’s pretty simple.
Thanks to this blog post from 2013, I found out that if you create an executable script called /usr/sbin/policy-rc.d with the content:
exit 101
This will stop all services in the dpkg/apt process from running on install, so I was able to do this:
Don’t do this! Turns out I was doing this wrong. The below code is only needed if you’ve got things wrong, and you should instead be using keep_vm = "on_success". The more you know, eh?
If you’ve got a command in your packer script that looks like this:
This will force packer to execute a command which is pushed into the background, returning a return code (RC) of 0, which the system will interpret as a successful result. 5 seconds later the machine will shut itself down by itself.
You’re probably in the install image which hasn’t been chrooted into.
You see, when AlmaLinux 9 does it’s install from ISO, it formats the disk and mounts it to /mnt/sysroot and then copies files to it. Once it’s done, the rest of the packer scripts can be run… but commands are run in the install environment, not the chroot container, so, to transfer files in, or to execute commands that will have actions in the target environment, format them like this:
That said, If you’re thinking of getting started with Proxmox though it’s well worth a read. If you’ve *used* Proxmox, and think I’m doing something wrong here, let me know in the comments!
Context
In the various podcasts I listen to, I’ve been hearing over and over again about Proxmox, and how it’s a great system for building and running virtual machines. In a former life, I’d use a combination of VMWare ESXi servers or desktop machines running Vagrant and Virtualbox to build out small labs and build environments, and at home I’d previously used a i3 ex-demo machine that was resold to staff at a reduced price. Unfortunately, the power supply went pop one evening on that, and all my home-lab experiments died.
When I changed to my most recent job, I had a small cash windfall at the same time, and decided to rebuild my home lab. I bought two Dell Optiplex 3040M i5 with 16GB RAM and two 3TB external USB3 hard drives to provide storage. These were selected because of the small size which meant they would fit in the small comms rack I had fitted when I got my house wired with CAT6 networking cables last year. These were patched into the UniFi USW-Pro-24 which was fitted as part of the networking build.
(Yes, it’s a bit of a mess, but it’s also not been in there very long, so needs a bit of a clean-up!)
The Install
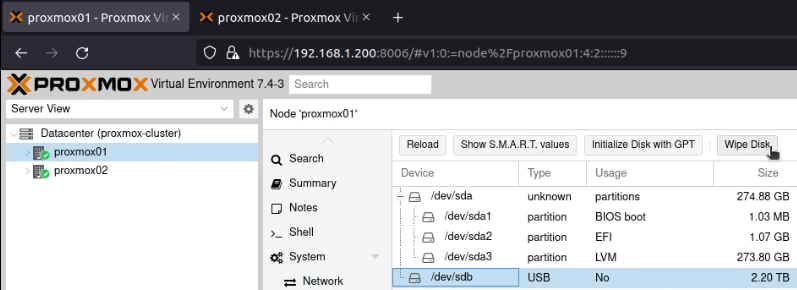
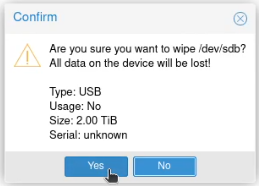
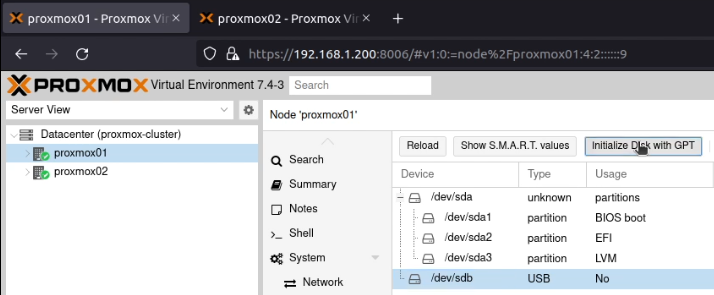
I allocated two static IP addresses for these hosts, and performed a standard installation of Proxmox using a USB stick with the multi-image-installer Ventoy on it.
Some screenshots follow:
Note that these screenshots were built on one pass, and have been rebuilt with new IPs that are used later.
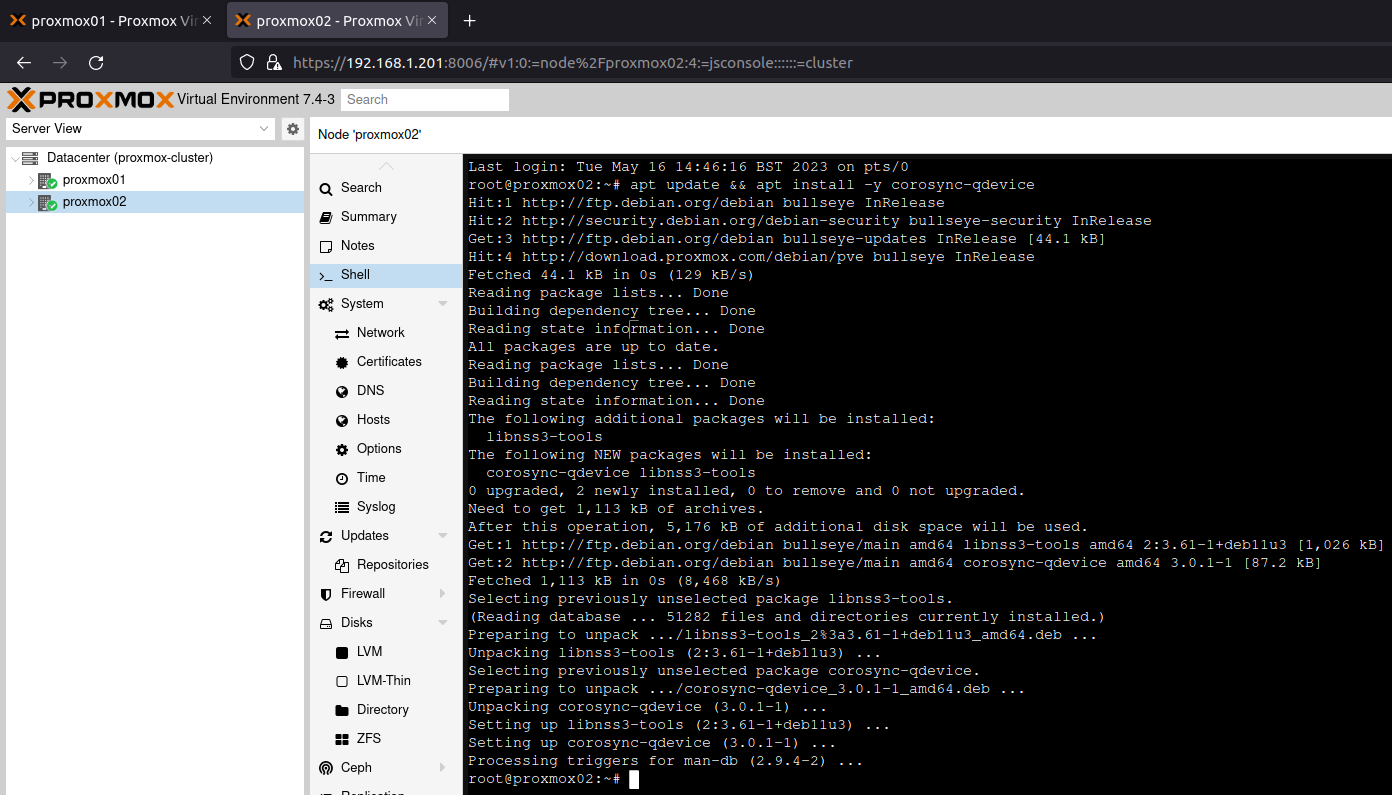
As I don’t have an enterprise subscription, I ran these commands to use tteck’sPost PVE Install script to change the repositories.
wget https://raw.githubusercontent.com/tteck/Proxmox/main/misc/post-pve-install.sh
# Run the following to confirm the download looks OK and non-corrupted
less post-pve-install.sh
bash post-pve-install.sh
This results in the following (time-lapse) output, which is a series of options asking you to approve making changes to the system.
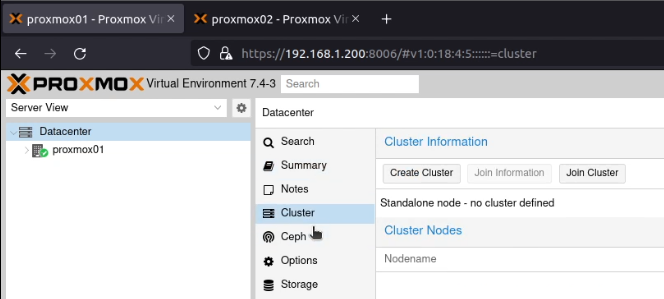
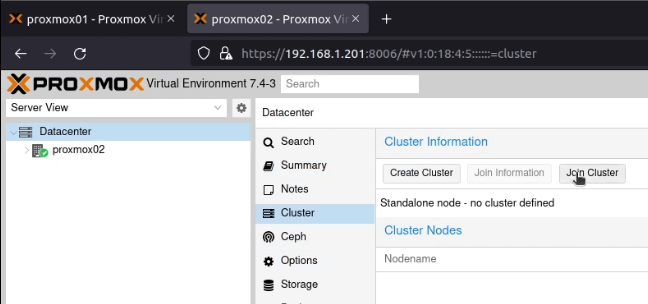
After signing into both Proxmox nodes, I went to my first node (proxmox01), selected “Datacenter” and then “Cluster”.
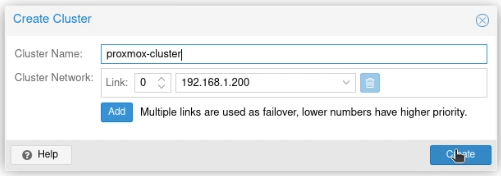
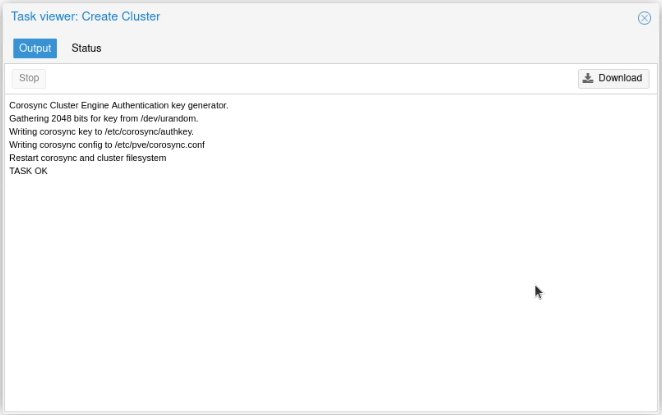
I clicked on “Create Cluster”, and created a cluster, called (unimaginatively) proxmox-cluster.
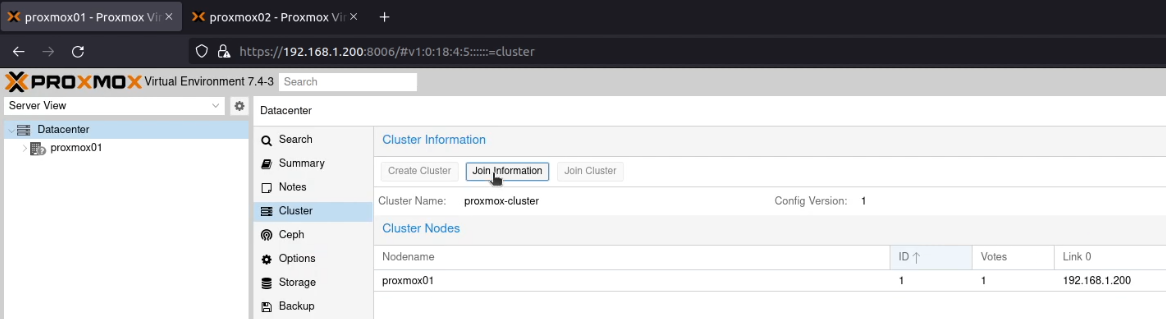
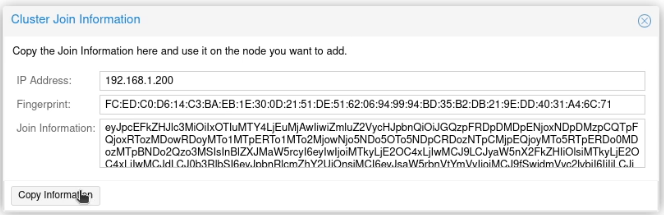
I clicked “Join Information”.
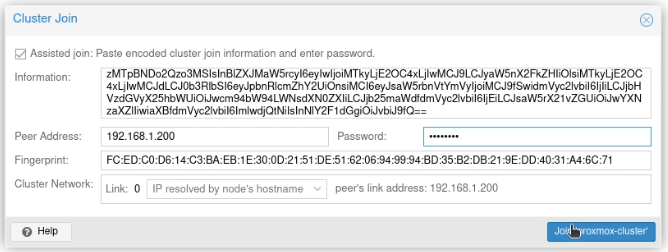
Next, on proxmox02 on the same screen, I clicked on “Join Cluster” and then pasted that information into the dialogue box. I entered the root password, and clicked “Join ‘proxmox-cluster'”.
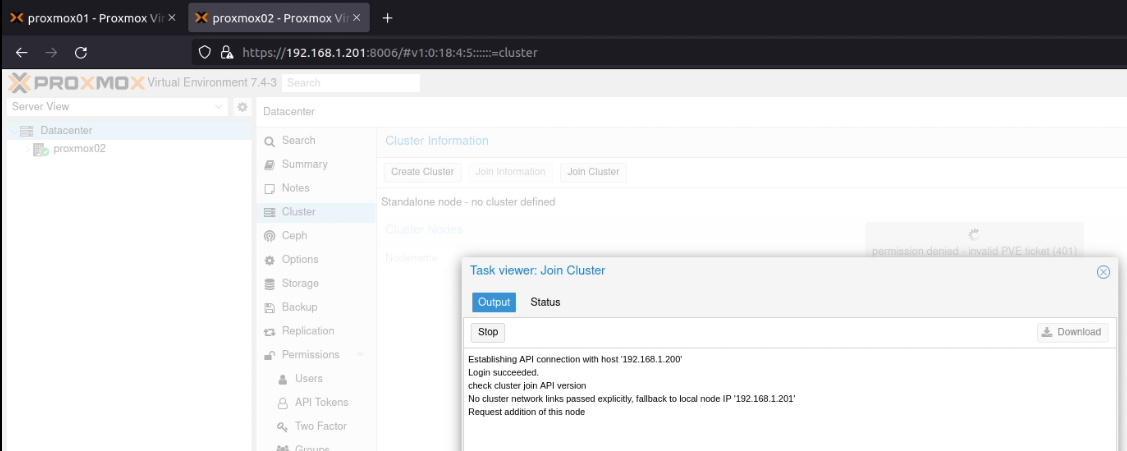
When this finished running, if either screen has hung, check whether one of the screens is showing an error like permission denied - invalid PVE ticket (401), like this (hidden just behind the “Task Viewer: Join Cluster” dialogue box):
Or /etc/pve/nodes/NODENAME/pve-ssl.pem' does not exist! (500):
Refresh your browsers, and you’ll probably find that the joining node will present a new TLS certificate:
Accept the certificate to resume the process.
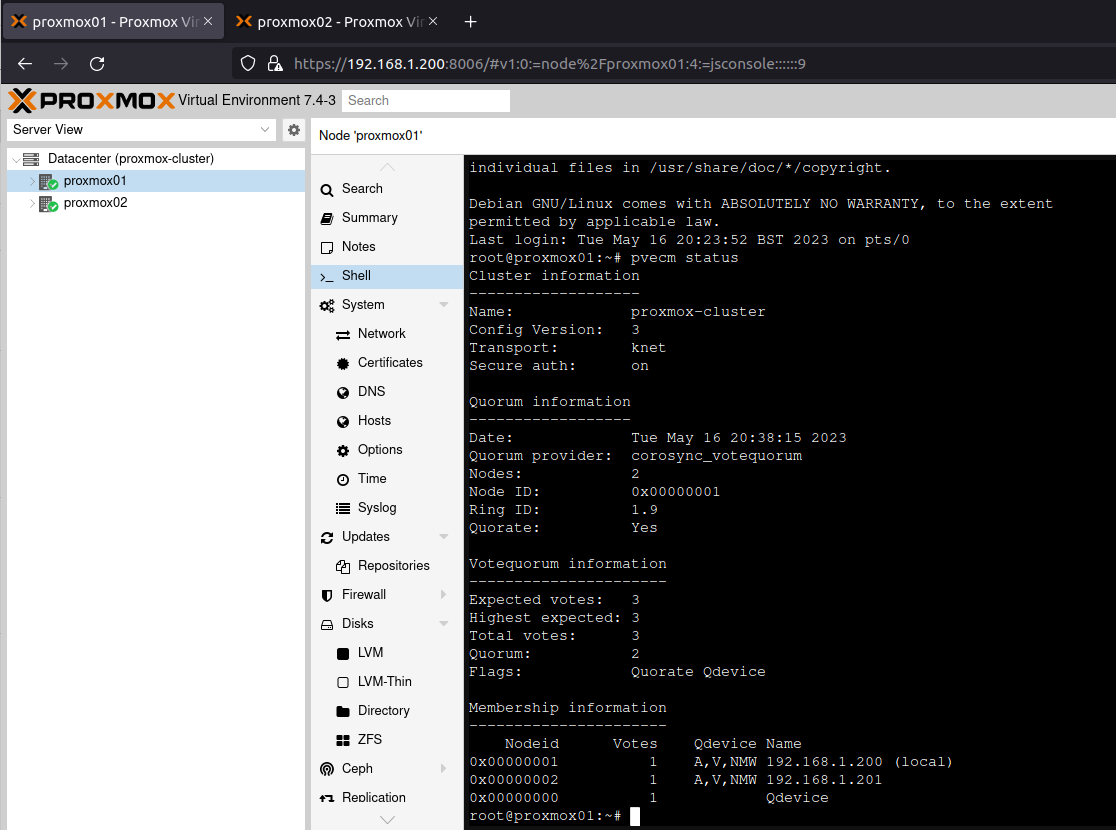
To ensure I had HA quorum, which requires three nodes, I added an unused Raspberry Pi 3 running Raspberry Pi OS.
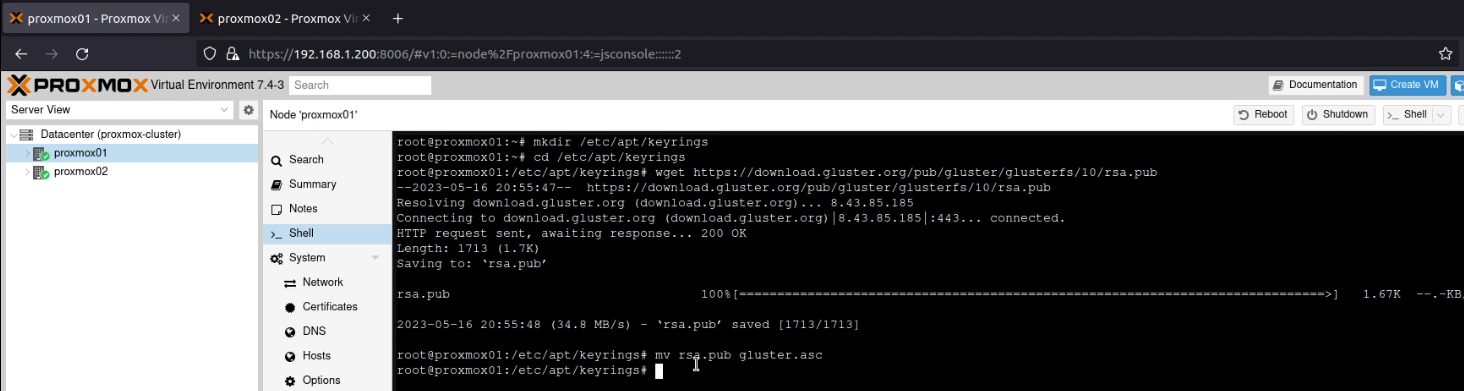
mkdir /etc/apt/keyrings
cd /etc/apt/keyrings
wget https://download.gluster.org/pub/gluster/glusterfs/10/rsa.pub
mv rsa.pub gluster.asc
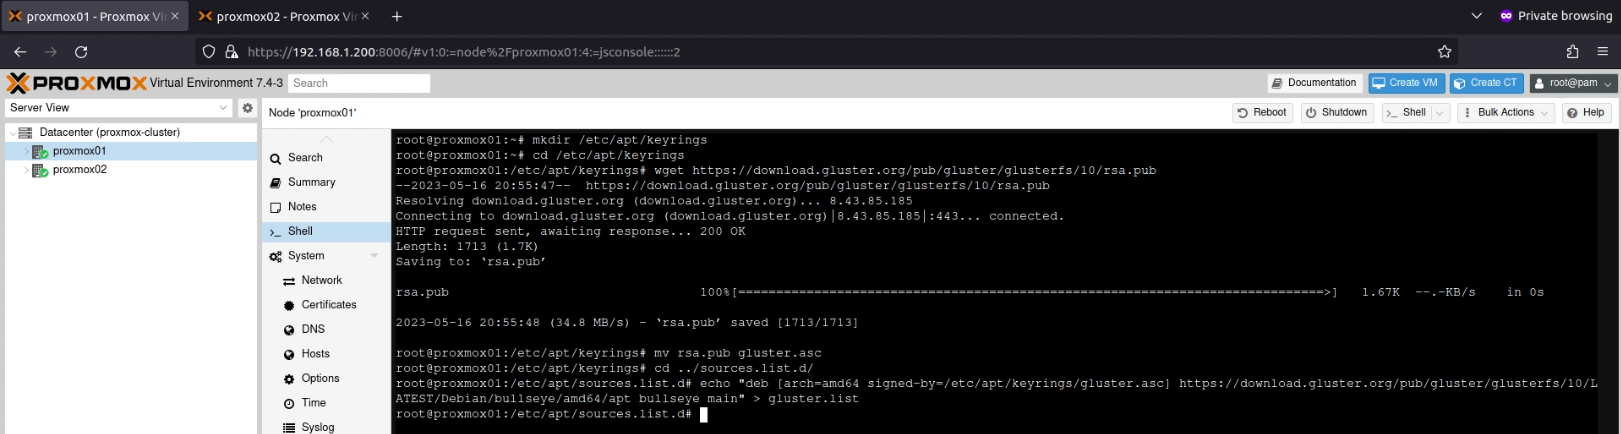
Next I created a new repository entry in /etc/apt/sources.list.d/gluster.listwhich contained the line:
deb [arch=amd64 signed-by=/etc/apt/keyrings/gluster.asc] https://download.gluster.org/pub/gluster/glusterfs/10/LATEST/Debian/bullseye/amd64/apt bullseye main
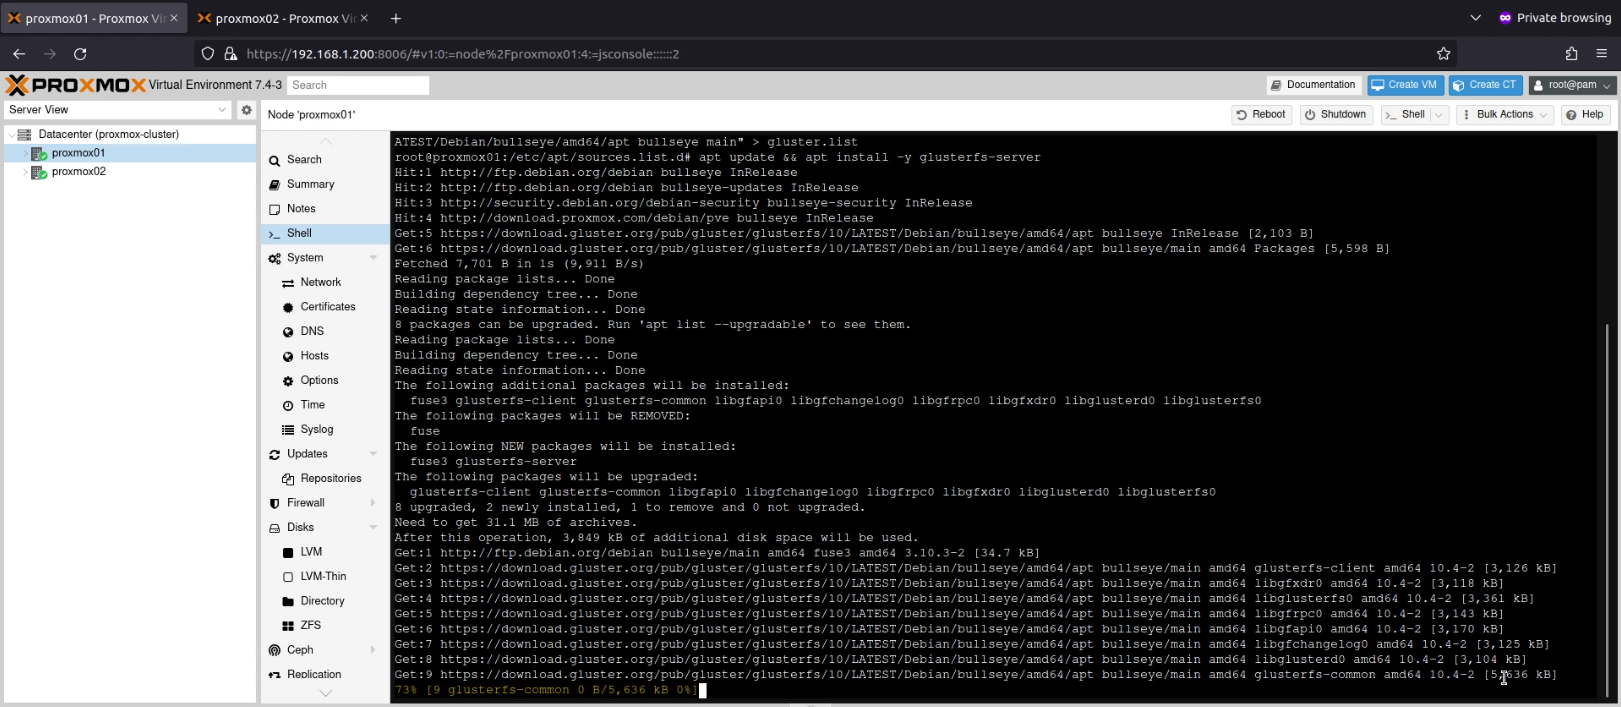
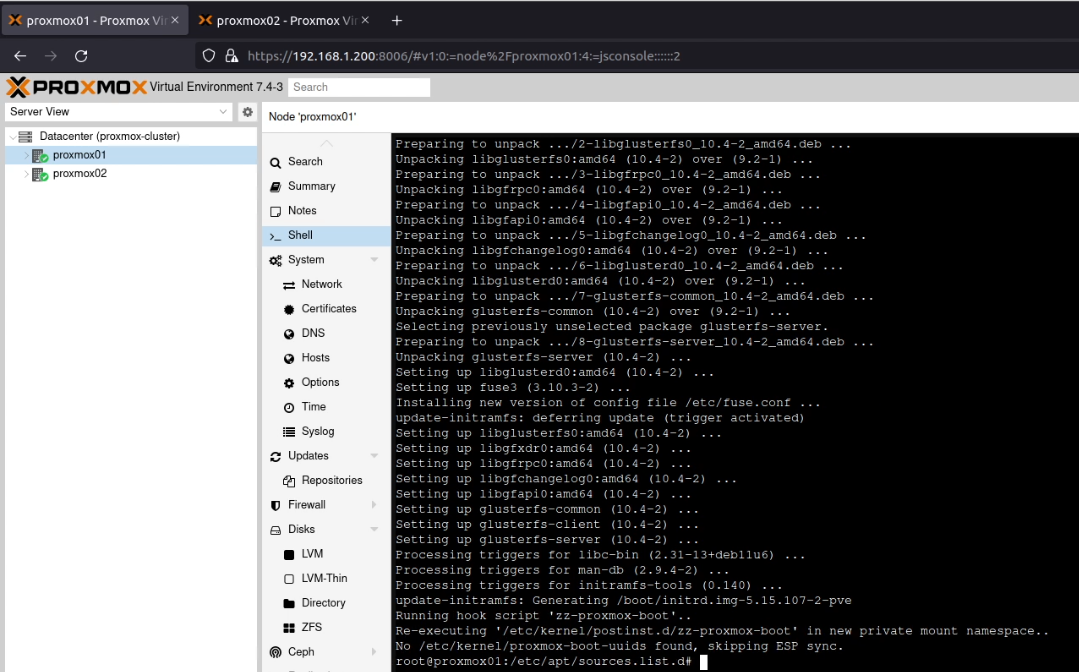
I next ran apt update && apt install -y glusterfs-serverwhich installed the Gluster service.
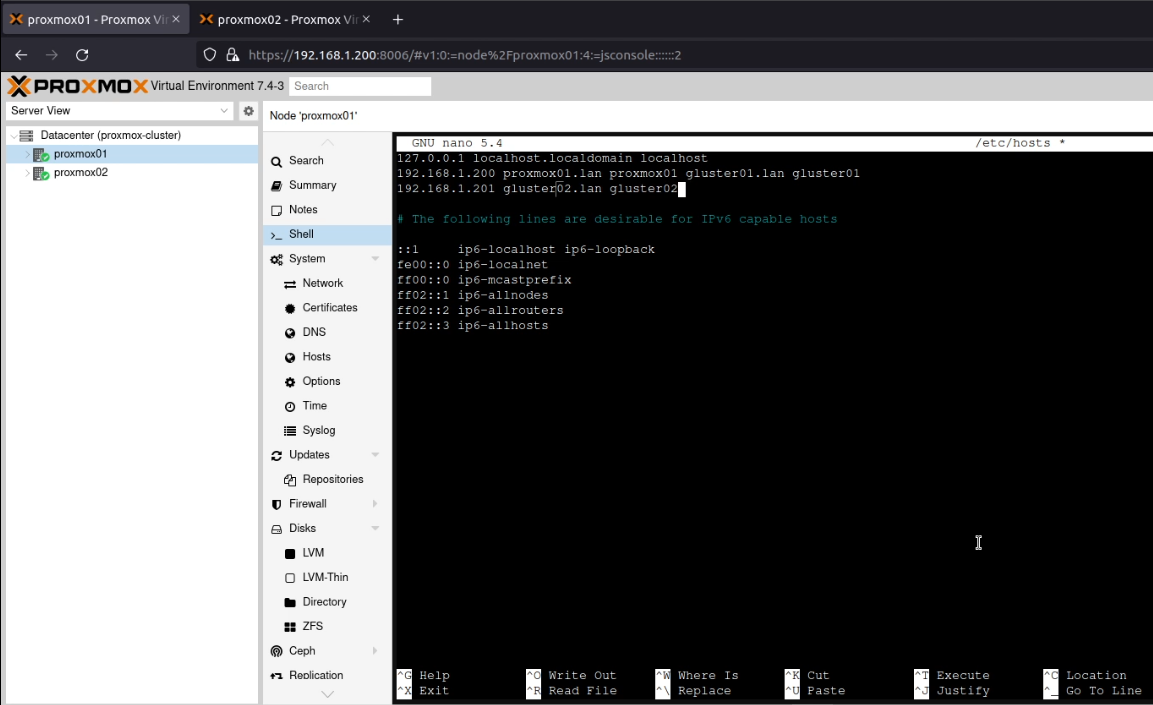
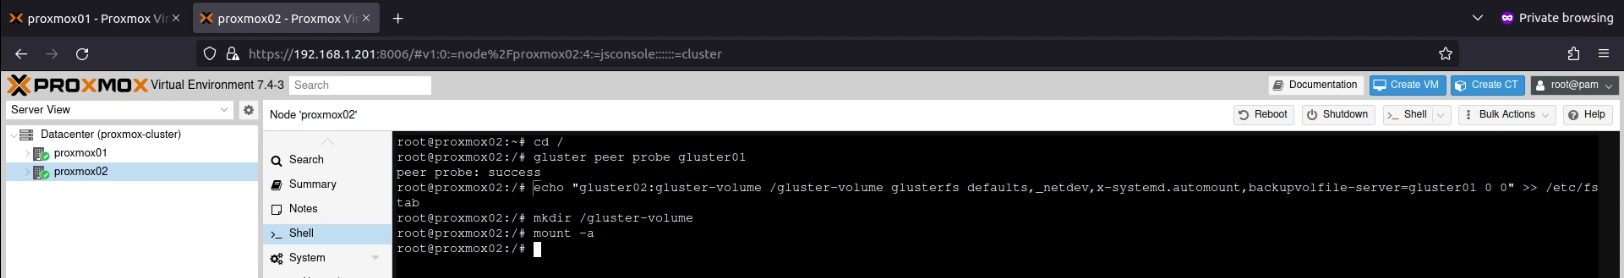
Following the YouTube link above, I created an entry for gluster01 and gluster02 in /etc/hosts which pointed to the IP address of proxmox01 and proxmox02 respectively.
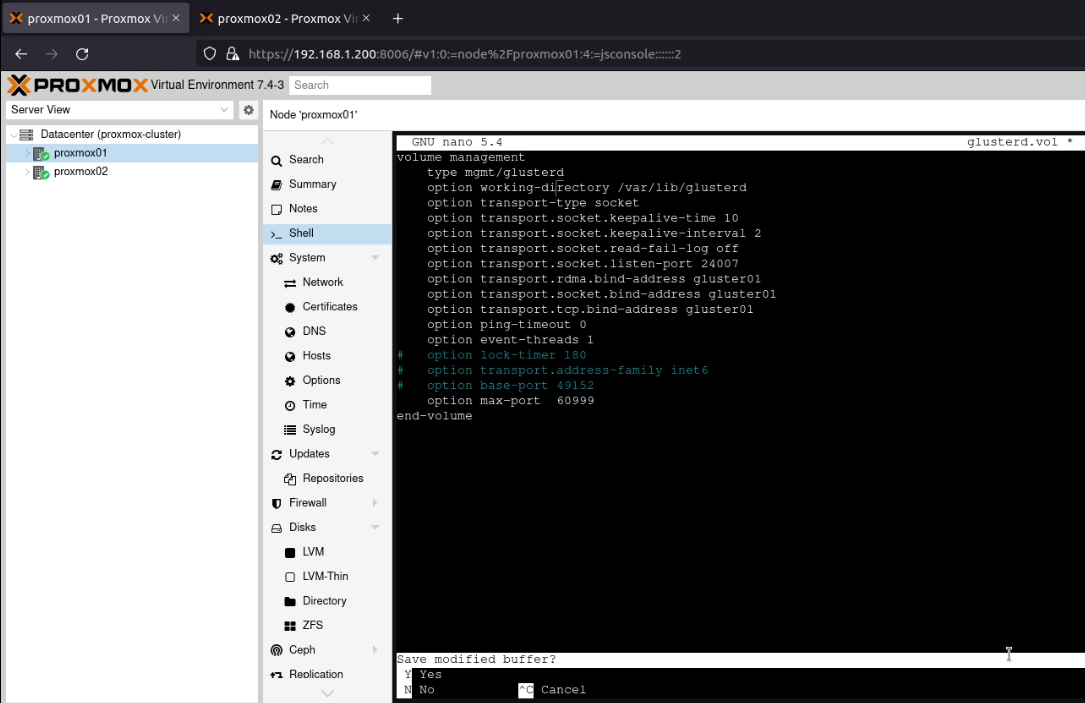
Next, I edited /etc/glusterfs/glusterd.volso it contained this content:
Note that this content above is for proxmox01. For proxmox02 I replaced “gluster01” with “gluster02”. I then ran systemctl enable --now glusterdwhich started the Gluster service.
Once this is done, you must run gluster probe gluster02from proxmox01 (or vice versa), otherwise, when you run the next command, you get this message:
volume create: gluster-volume: failed: Host gluster02 is not in 'Peer in Cluster' state
(This takes some backing out… ugh)
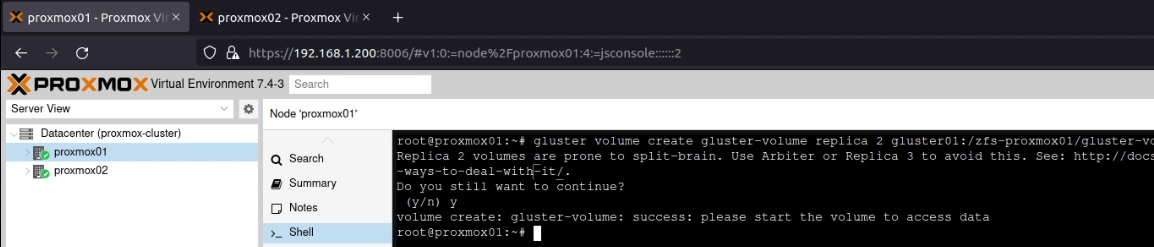
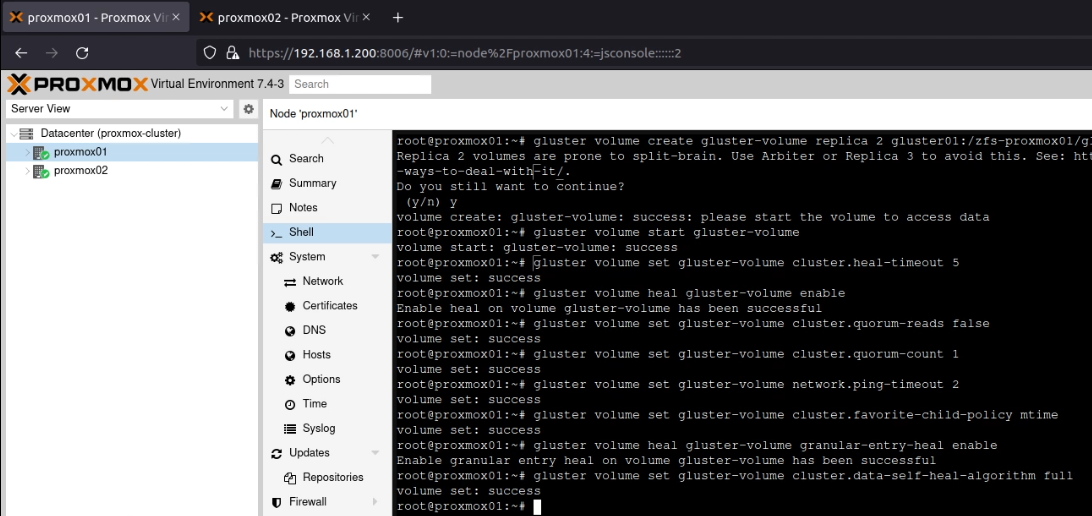
On proxmox01, I created the volume using this command:
As you can see in the above screenshot, this warned about split brain situations. However, as this is for my home lab, I accepted the risk here. Following the YouTube video again, I ran these commands to “avoid [a] split-brain situation”:
gluster volume start gluster-volume
gluster volume set gluster-volume cluster.heal-timeout 5
gluster volume heal gluster-volume enable
gluster volume set gluster-volume cluster.quorum-reads false
gluster volume set gluster-volume cluster.quorum-count 1
gluster volume set gluster-volume network.ping-timeout 2
gluster volume set gluster-volume cluster.favorite-child-policy mtime
gluster volume heal gluster-volume granular-entry-heal enable
gluster volume set gluster-volume cluster.data-self-heal-algorithm full
I created /gluster-volume on both proxmox01 and proxmox02, and then added this line to /etc/fstab(yes, I know it should really have been a systemd mount unit) on proxmox01:
On both systems, I ensured that /gluster-volume was created, and then ran mount -a.
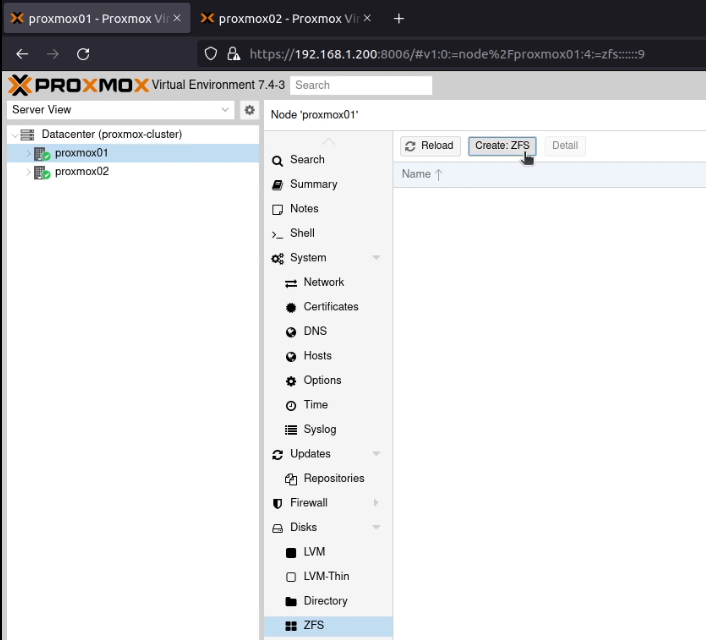
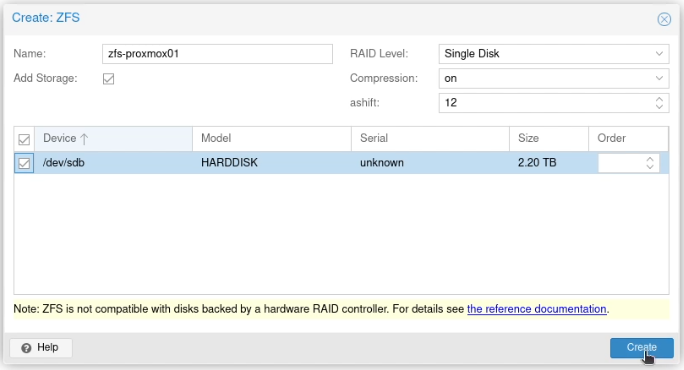
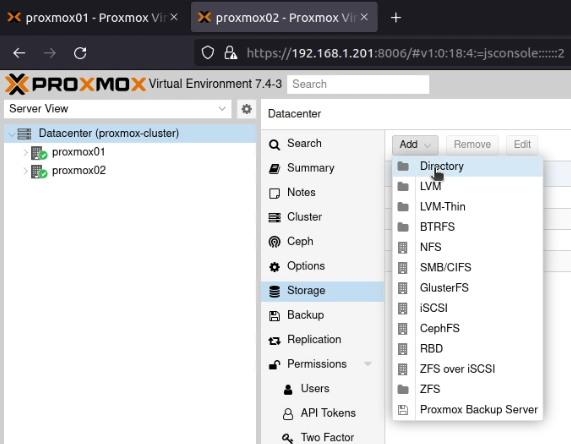
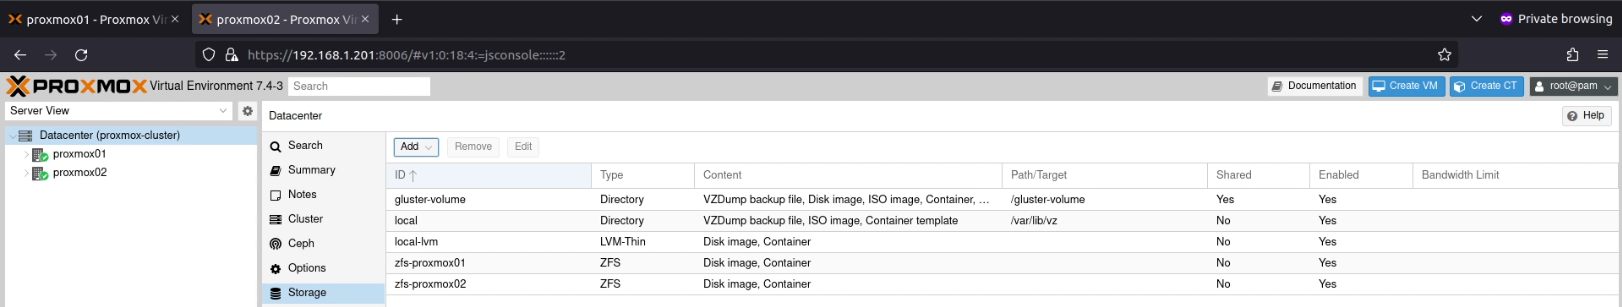
In the Proxmox UI, I went to the “Datacenter” and selected “Storage”, then “Add” and selected “Directory”.
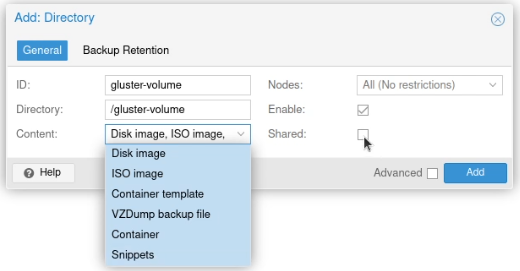
I set the ID to “gluster-volume”, the directory to “/gluster-volume”, ticked the “Shared” box and selected all the content types (it looks like a list box, but it’s actually a multi-select box).
(I forgot to click “Shared” before I selected all the items under “Content” here.)
I clicked Add and it was available on both systems then.
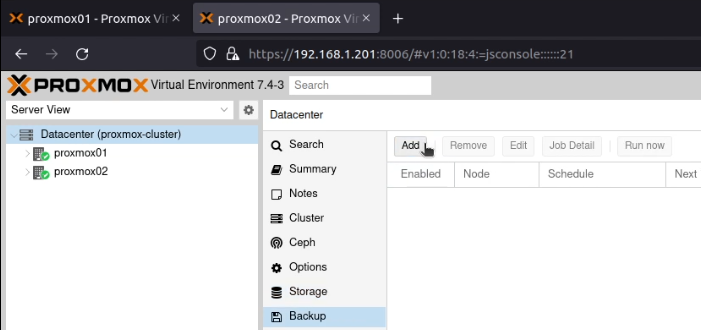
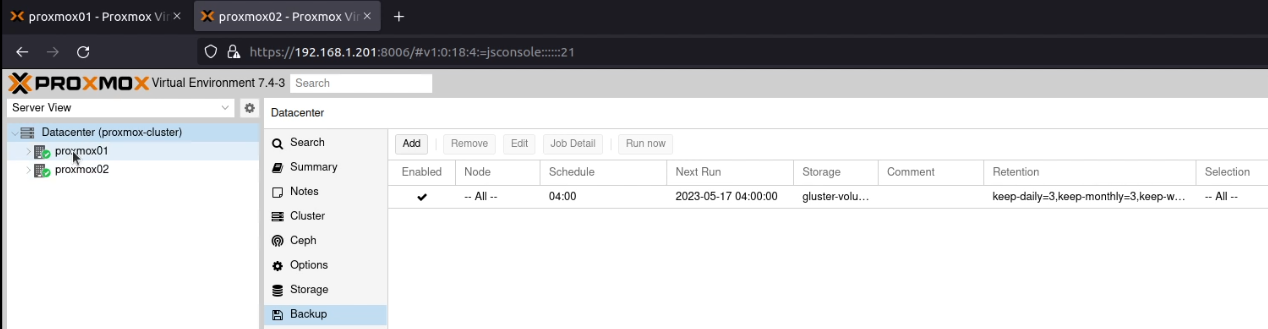
Backups
This one saved me from having to rebuild my Home Assistant system last week! Go into “Datacenter” and select the “Backup” option.
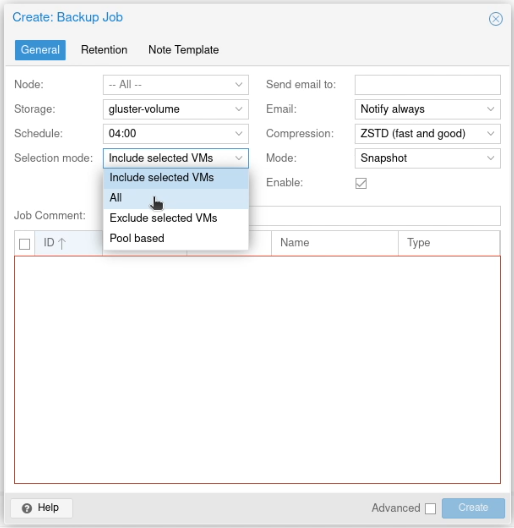
Click the “Add” button, select the storage you’ve just configured (gluster-volume) and a schedule (I picked daily at 04:00) and choose “Selection Mode” of “All”.
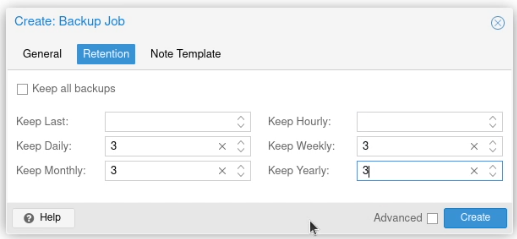
On the retention tab, I entered the number 3 for “Keep Daily”, “Keep Weekly”, “Keep Monthly” and “Keep Yearly”. Your retention needs are likely to be different to mine!
If you end up needing to restore one of these backups, you need a different tool depending on whether it’s a LXC container or a QEMU virtual machine. For a container, you’d run:
vmid=199
pct restore $vmid /path/to/backup-file
For a virtual machine, you’d run:
vmid=199
qmrestore /path/to/backup-file $vmid
…and yes, you can replace the vmid=199 \n $vmidwith just the number for the VMID like this:
If you need to point the storage at a different device (perhaps Gluster broke, or your external drive) you’d add --storage storage-label(e.g. --storage local-lvm)
Networking
The biggest benefit for me of a home lab is being able to build things on their own VLAN. A VLAN allows a single network interface to carry traffic for multiple logical networks, in such a way that other ports on the switch which aren’t configured to carry that logical network can’t access that traffic.
For example, I’ve configured my switch to have a new VLAN on it, VLAN 30. This VLAN is exposed to the two Proxmox servers (which can access all the VLANs) and also the port to my laptop. This means that I can run virtual machines on VLAN 30 which can’t be accessed by any other machine on my network.
There are two ways to do this, the “easy way” and the “explicit way”. Both ways produce the same end state, it’s just down to which makes more logical sense in your head.
In both routes, you must create the VLANs on your switch first – I’m just addressing the way of configuring Proxmox to pass this traffic to your network switch.
Note that these VLAN tagged interfaces also don’t have a DHCP server or Internet gateway (unless you create one), so any addresses will need to be manually configured in any installation screens.
The easy way
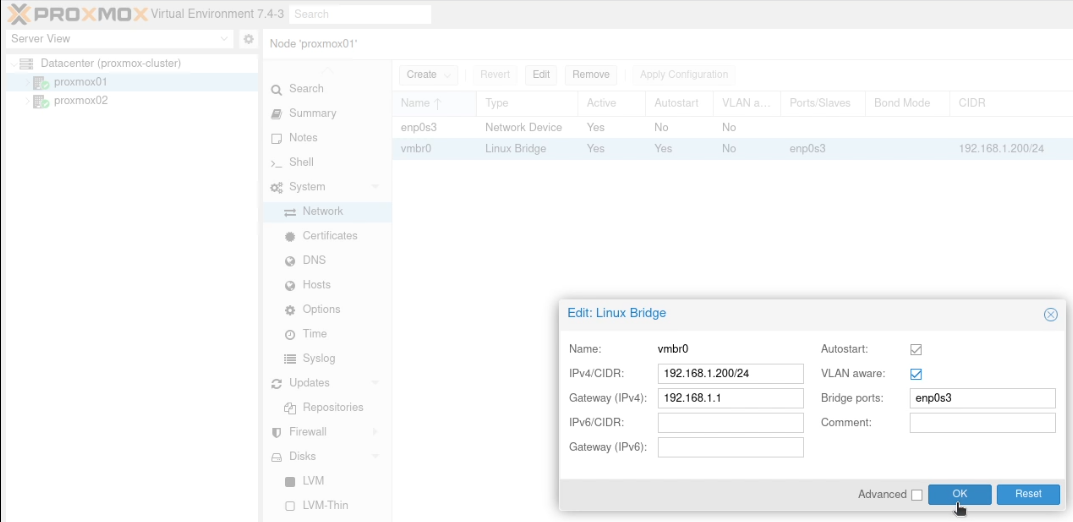
Go into the individual nodes and select the Network option in the sidebar (nested under “System”). You’ll need to perform these actions on both nodes.
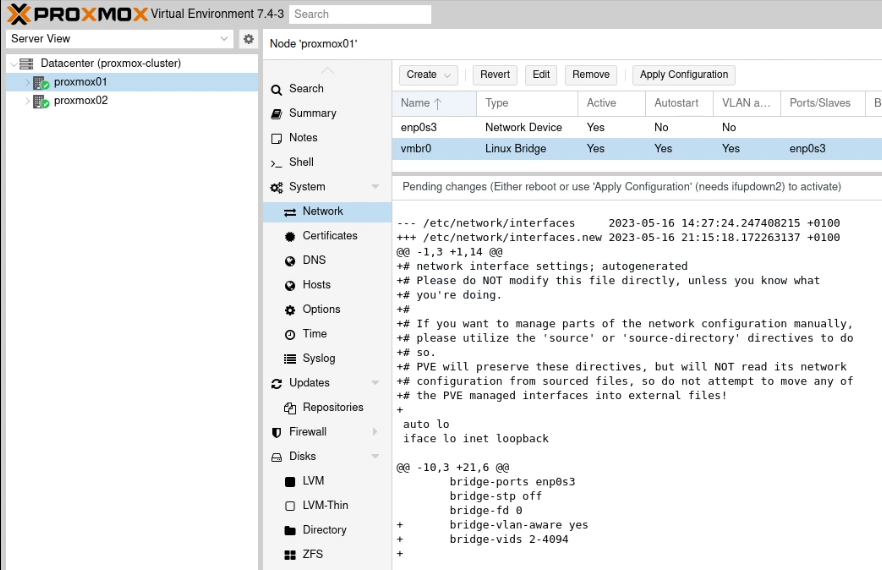
Click on the “Linux Bridge” line which is aligned to your “trunked” network interface. For me, as I have a single network interface (enp2s0) I have a single Linux Bridge (vmbr0). Click “Edit” and tick the “VLAN aware” box and click “OK”.
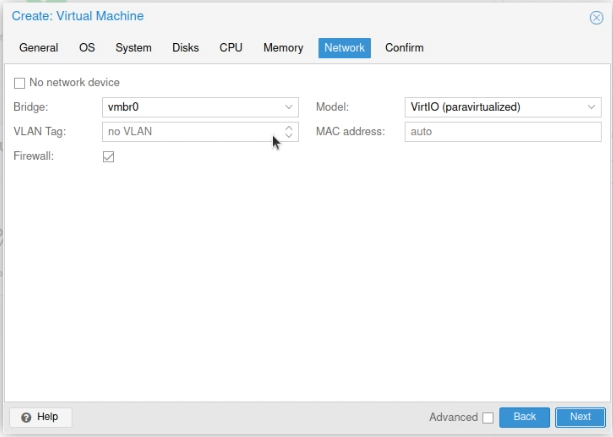
When you now create your virtual machines, on the hardware option in the sidebar, find the network interface and enter the VLAN tag you want to assign.
(This screenshot shows no VLAN tag added, but it’s fairly clear where you’d put that tag in there)
The explicit way
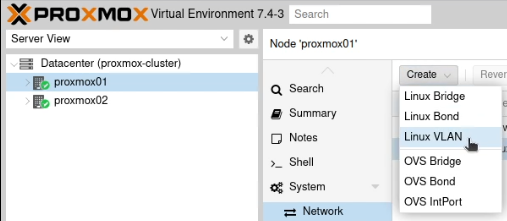
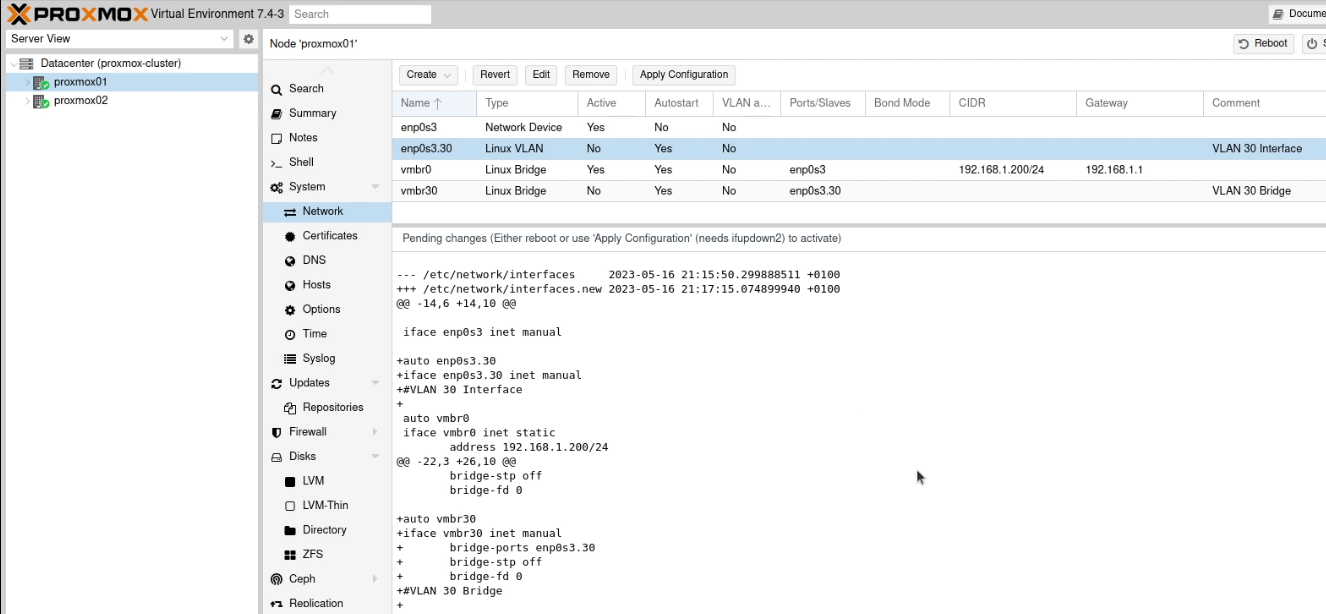
Go into the individual nodes and select the Network option in the sidebar. You’ll need to perform all the steps in the section on both nodes!
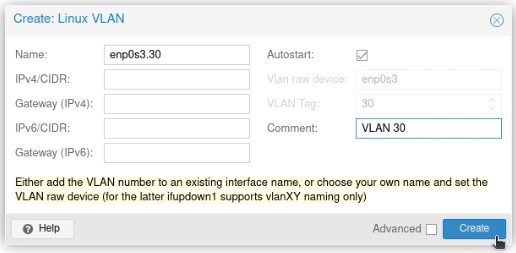
Create a new “Linux VLAN” object.
Call it by the name of the interface (e.g. enp2s0) followed by a dot and then the VLAN tag, like this enp2s0.30. Click Create.
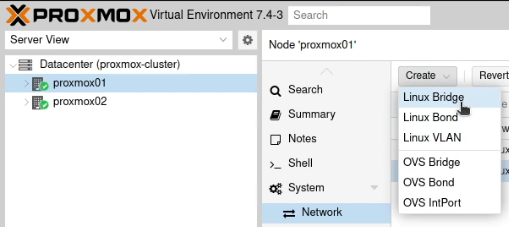
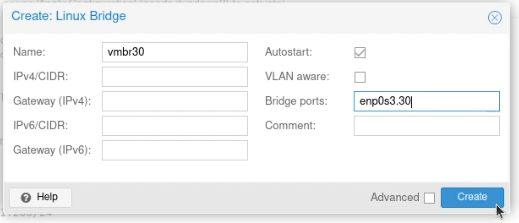
Next create a new “Linux Bridge”.
Call it vmbr and then the VLAN tag, like this vmbr30. Set the ports to the VLAN you just created (enp2s0.30)
(I should note that I added the comment between writing this guide and taking these screen shots)
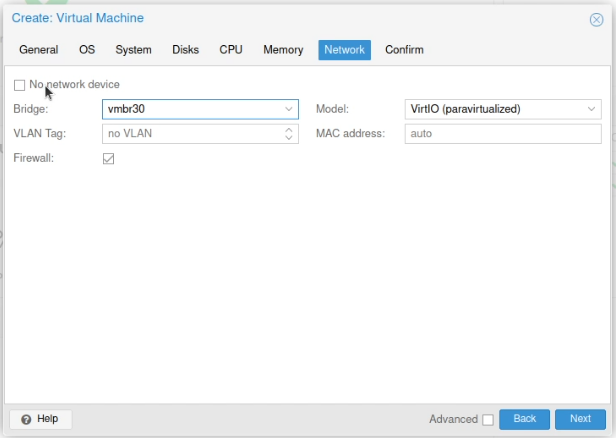
When you create your virtual machines select this bridge for accessing that VLAN.
Making machines run in “HA”
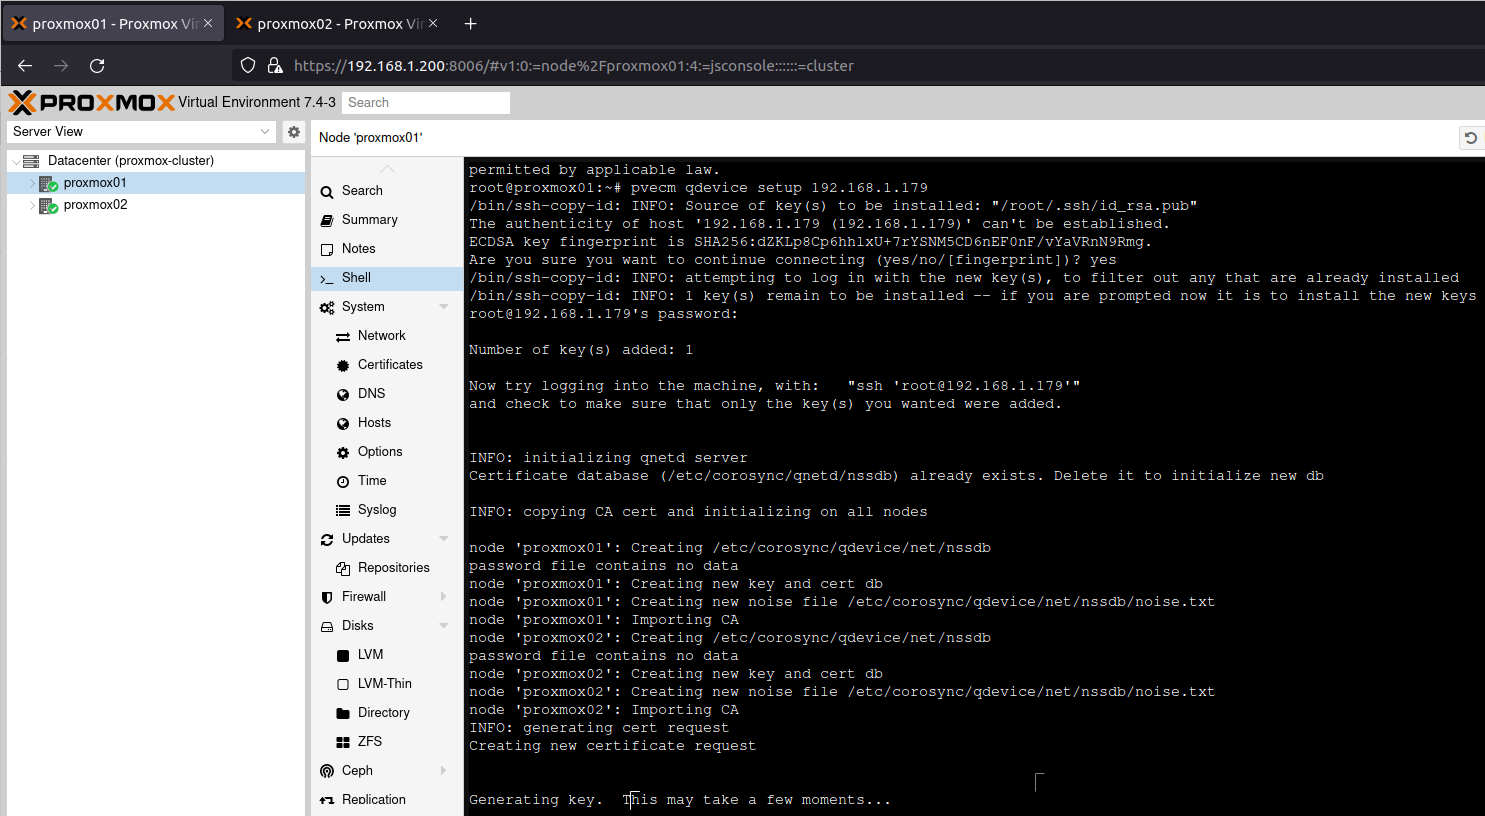
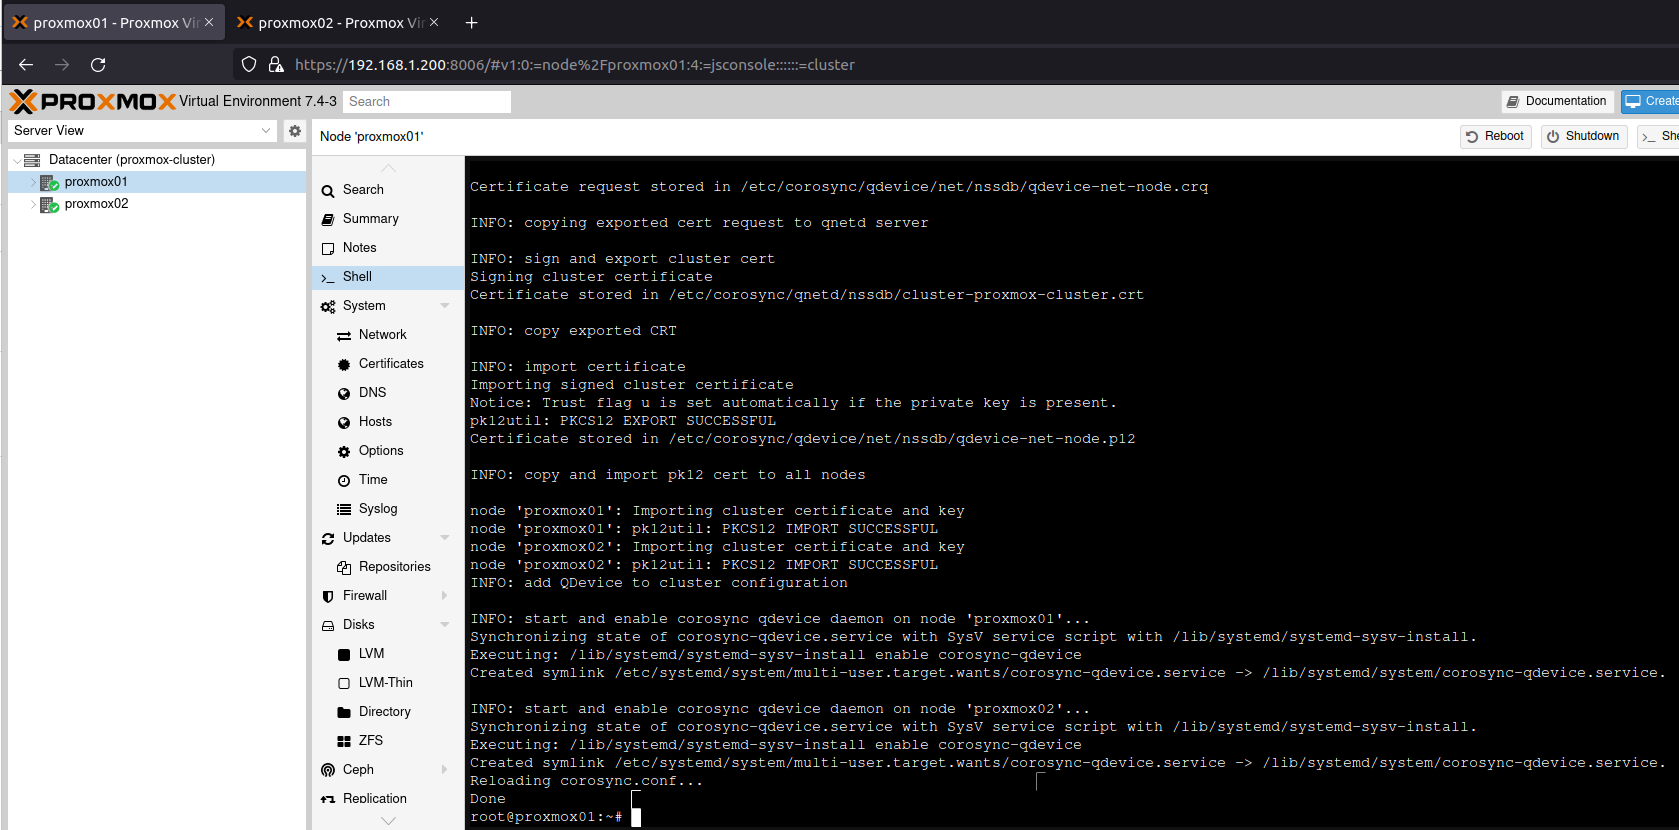
If you haven’t already done the part with the QDevice under clustering, go back there and run those steps! You need quorum to do this right!
YOU MUST HAVE THE SAME NETWORK AND STORAGE CONFIGURATION FOR HIGH AVAILABILITY AND MIGRATIONS. This means every VM which you want to migrate from proxmox01 to proxmox02 must use the same network interface and storage device, no matter which host it’s connected to.
If you’re connecting enp2s0 to VLAN 55 by using a VLAN Bridge called vmbr55, then both nodes need this VLAN Bridge available. Alternatively, if you’re using a VLAN tag on vmbr0, that’s fine, but both nodes need to have vmbr0 set to be “VLAN aware”.
If you’re using a disk on gluster-volume, this must be shared across the cluster
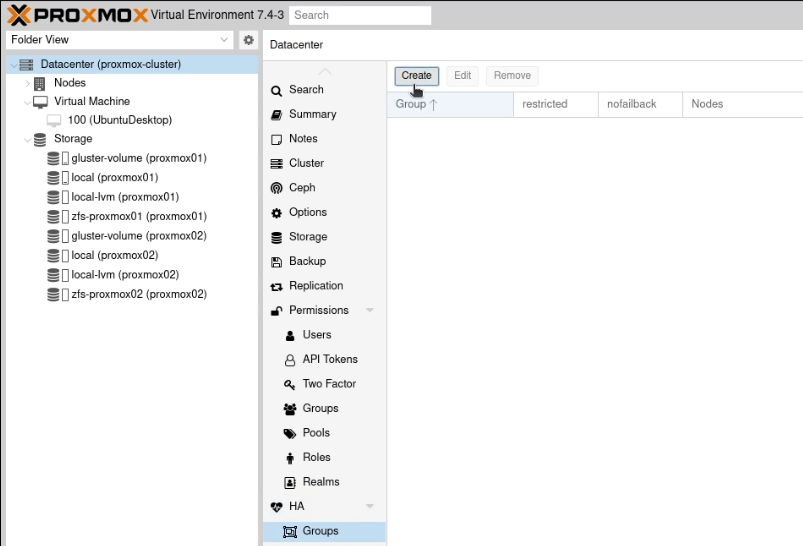
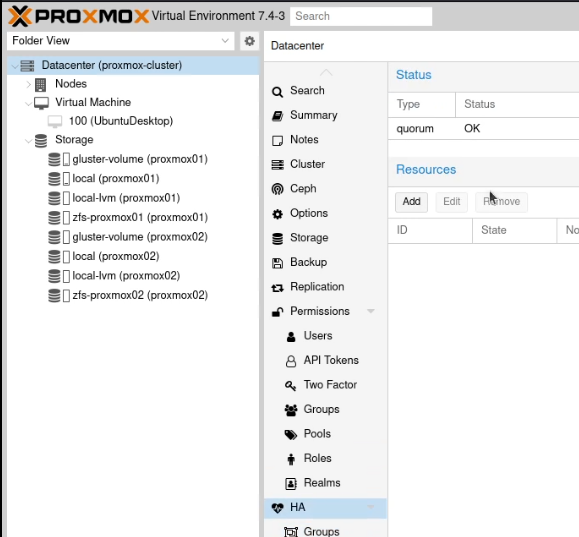
Go to “Datacenter” and select “Groups” which is nested under “HA” in the sidebar.
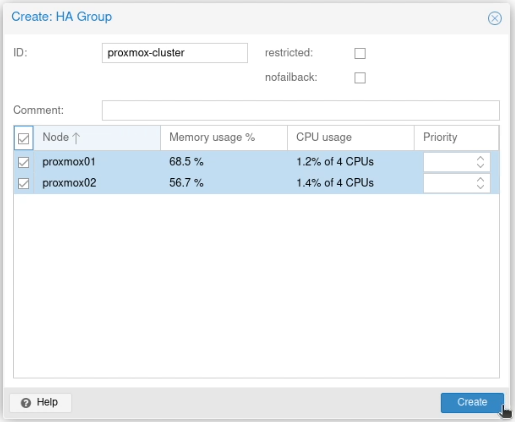
Create a new group (again, unimaginatively, I went with “proxmox”). Select both nodes and press Create.
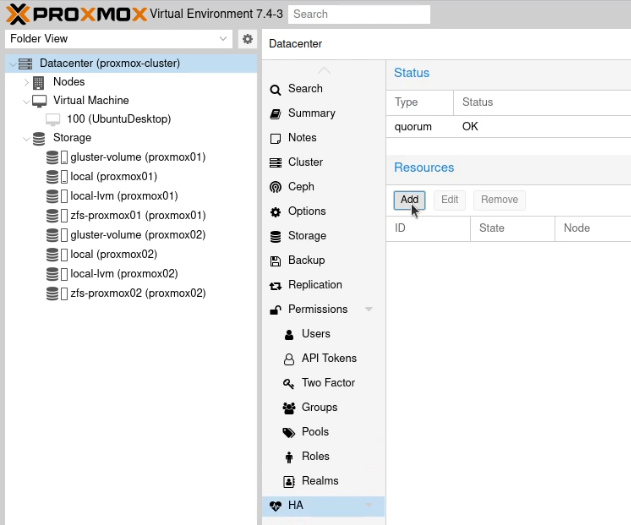
Now go to the “HA” option in the sidebar and verify you have quorum, although it doesn’t matter which is the master.
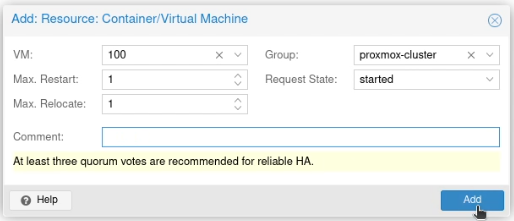
Under resources on that page, click “Add”.
In the VM box, select the ID for the container or virtual machine you want to be highly available and click Add.
This will restart that machine or container in HA mode.
The wrap up!
So, after all of this, there’s still no virtual machines running (well, that Ubuntu Desktop is created but not running yet!) and I’ve not even started playing around with Terraform yet… but I’m feeling really positive about Proxmox. It’s close enough to the proprietary solutions I’ve used at work in the past that I’m reasonably comfortable with it, but it’s open enough to mess around under the surface. I’m looking forward to doing more experiments!
The featured image is of the comms rack in my garage showing how bad my wiring is when I can’t get to the back of a rack!! It’s released under a CC-0 license.
I recently obtained a new laptop, so installed Ubuntu with the encrypted ZFS root filesystem. This all works great! I then installed the DisplayLink drivers using the system recommended by Synaptics;
At which point I’m prompted to reboot my system. All good, so far.
Except, what I’m presented with is a recovery console, asking me to enter my root password!
Fortunately, I’d had the common sense to set the password for my root account (sudo passwdwill do it), so I could sign in and start to figure out what was going on.
In my logs, I looked for anything to do with “displaylink”, and found this line:
Apr 28 11:13:05 jonspriggs-Kratos-EL04R6 systemd-udevd[1912]: 4-3.1.3:1.0: Spawned process '/opt/displaylink/udev.sh /dev /devices/pci0000:00/0000:00:14.0/usb4/4-3/4-3.1/4-3.1.3/4-3.1.3:1.0 usb-004-004-DisplayLink_PR09_DisplayPort_Dock_YVFJ093338 /dev/bus/usb/004/004' [2280] is taking longer than 59s to complete
Just after, it showed this log:
Apr 28 11:14:05 jonspriggs-Kratos-EL04R6 systemd[1]: systemd-udev-settle.service: Main process exited, code=exited, status=1/FAILURE
░░ Subject: Unit process exited
░░ Defined-By: systemd
░░ Support: http://www.ubuntu.com/support
░░
░░ An ExecStart= process belonging to unit systemd-udev-settle.service has exited.
░░
░░ The process' exit code is 'exited' and its exit status is 1.
So, my initial response was to purge the displaylink-driver (which I did, and it worked), but I actually quite like this dock, so I re-installed the driver and took a look at what else was in there.
Between the systemd-udev-settle.service starting and finishing with an error was this log entry:
Apr 28 11:12:05 jonspriggs-Kratos-EL04R6 udevadm[1890]: systemd-udev-settle.service is deprecated. Please fix zfs-load-module.service, zfs-import-cache.service not to pull it in.
Hmm, I wonder if that’s what the issue is?! So, I edited zfs-load-module.service (/lib/systemd/system/zfs-load-module.service) and zfs-import-cache.service (/lib/systemd/system/zfs-import-cache.service) files commenting out the line: Requires=systemd-udev-settle.serviceand restarted.
The system booted straight up! Huzzah!
I’ve had a look in the logs, and prior to installing the DisplayLink driver, I was getting this error above, but as systemd-udev-settle wasn’t failing to start, it wasn’t preventing zfs from loading, which in turn was preventing the boot, so the issue is definitely somewhere between DisplayLink and systemd-udev-settle, but we’ll see what happens as a result of this issue.
I recently was in the situation where I had two github profiles (one work, one personal) that I needed to incorporate in projects.
My work account on this device is my “default”, I use it to push, pull and so on, but the occasional personal activities (like terminate-notice) all should be attributed to my personal account.
To make this happen, I used direnv which reads a .envrcfile in the parents of the directory you’re currently in. I created a directory for my personal projects – ~/Code/Personaland placed a .envrc file which contains:
This means that I have a specific SSH key just for my personal activities (~/.ssh/personal.id_ed25519) and I’ve got my email address defined as two environment variables – AUTHOR (who wrote the code) and COMMITTER (who added it to the tree) – both are required when you’re changing them like this!
Because I don’t ever want it to try to use my SSH Agent, I’ve added the fact that SSH_AUTH_SOCK should be empty.
As an aside, work also require Commit Signing, but I don’t want to use that for my personal projects right now, so I also discovered a new feature as-of 2020 – the environment variables GIT_CONFIG_KEY_x, GIT_CONFIG_VALUE_x and GIT_CONFIG_COUNT=x
By using these, you can override any system, global and repo-level configuration values, like this:
This ensures that I *will not* GPG Sign commits, tags or pushes.
If I accidentally cloned a repo into an unusual location, or on purpose need to make a directory or submodule a personal repo, I just copy the .envrc file into that part of the tree, run direnv allowand hey-presto! I’ve turned that area into a personal repo, without having to remember the .gitconfigstring to mark a new part of my tree as a personal one.