Yesterday I was struggling a bit with a bash script I was writing. I needed to stop it from running flat out through every loop, and I wanted to see what certain values were at key points in the script.
Yes, I know I could use “read” to pause the script and “echo” to print values, but that leaves a lot of mess that I need to clean up afterwards… so I went looking for something else I could try.
You can have extensive debug statements, which are enabled with a --debug flag or environment variable… but again, messy.
You can run bash -x ./myscript.sh – and, indeed, I do frequently do that… but that shows you the commands which were run at each point, not what the outcome is of each of those commands.
If my problem had been a syntax one, I could have installed shellcheck, which is basically a linter for Bash and other shell scripting languages, but no, I needed more detail about what was happening during the processing.
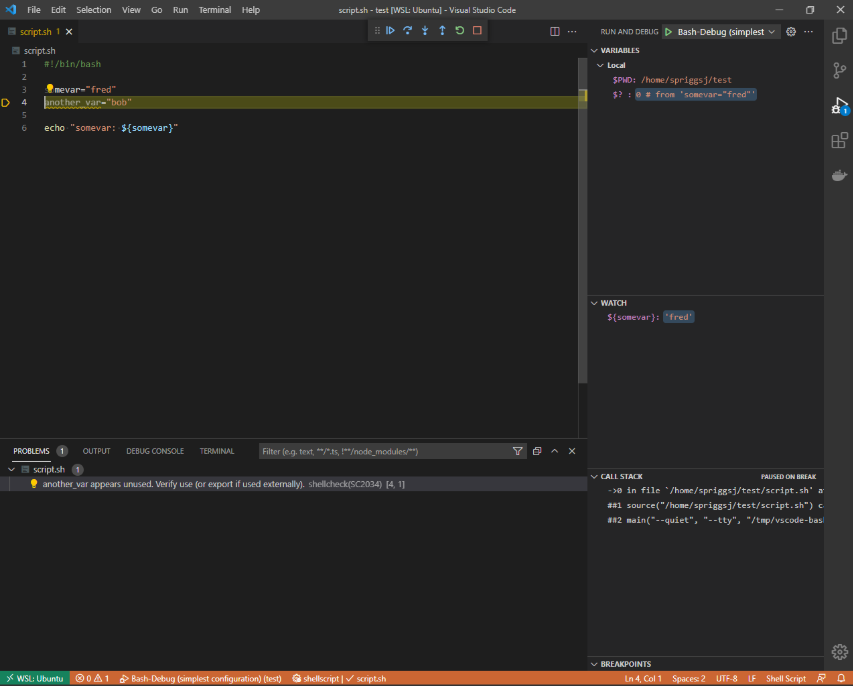
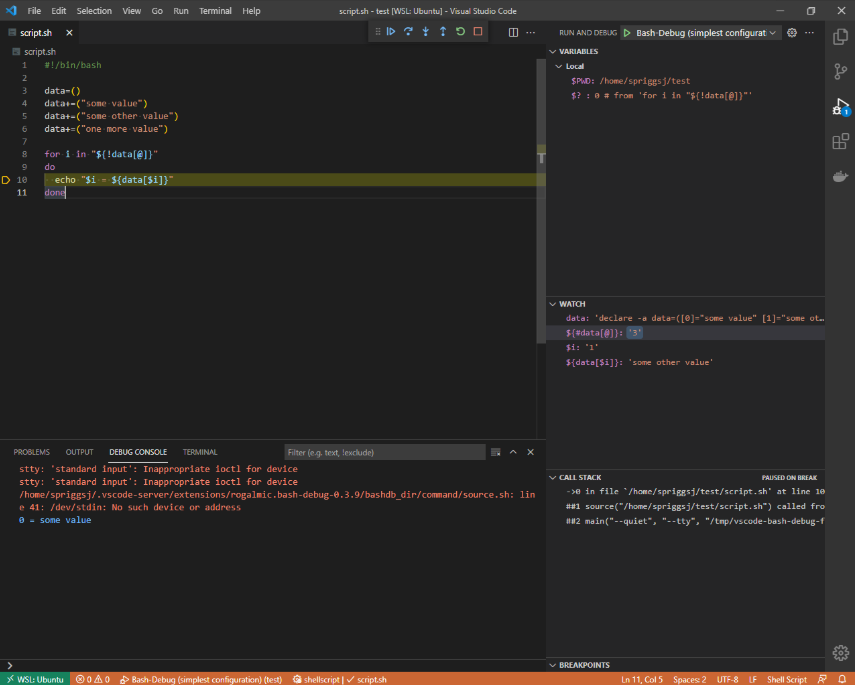
Instead, I wanted something like xdebug (from PHP)… and I found Bash Debug for VSCode. This doesn’t even need you to install any scripts or services on the target machine – it’s interactive, and has a “watch” section, where you either highlight and right-click a variable expression (like $somevar or ${somevar}) to see when it changes. You can see where in the “callstack” you are and see what values are registered by that script.


All in all, a worthy addition to my toolbelt!
Featured image is “DeBugged!” by “Randy Heinitz” on Flickr and is released under a CC-BY license.


