"Apoptosis Network (alternate)" by "Simon Cockell" on Flickr

A few weird issues in the networking on our custom AWS EKS Workers, and how we worked around them

For “reasons”, at work we run AWS Elastic Kubernetes Service (EKS) with our own custom-built workers. These workers are based on Alma Linux 9, instead of AWS’ preferred Amazon Linux 2023. We manage the deployment of these workers using AWS Auto-Scaling Groups.

Our unusal configuration of these nodes mean that we sometimes trip over configurations which are tricky to get support on from AWS (no criticism of their support team, if I was in their position, I wouldn’t want to try to provide support for a customer’s configuration that was so far outside the recommended configuration either!)

Over the past year, we’ve upgraded EKS1.23 to EKS1.27 and then on to EKS1.31, and we’ve stumbled over a few issues on the way. Here are a couple of notes on the subject, in case they help anyone else in their journey.

All three of the issues below were addressed by running an additional service on the worker nodes in a Systemd timed service which triggers every minute.

Incorrect routing for the 12th IP address onwards

Something the team found really early on (around EKS 1.18 or somewhere around there) was that the AWS VPC-CNI wasn’t managing the routing tables on the node properly. We raised an issue on the AWS VPC CNI (we were on CentOS 7 at the time) and although AWS said they’d fixed the issue, we currently need to patch the routing tables every minute on our nodes.

What happens?

When you get past the number of IP addresses that a single ENI can have (typically ~12), the AWS VPC-CNI will attach a second interface to the worker, and start adding new IP addresses to that. The VPC-CNI should setup routing for that second interface, but for some reason, in our case, it doesn’t. You can see this happens because the traffic will come in on the second ENI, eth1, but then try to exit the node on the first ENI, eth0, with a tcpdump, like this:

[root@test-i-01234567890abcdef ~]# tcpdump -i any host 192.0.2.123
tcpdump: data link type LINUX_SLL2
dropped privs to tcpdump
tcpdump: verbose output suppressed, use -v[v]... for full protocol decode
listening on any, link-type LINUX_SLL2 (Linux cooked v2), snapshot length 262144 bytes
09:38:07.331619 eth1  In  IP ip-192-168-1-100.eu-west-1.compute.internal.41856 > ip-192-0-2-123.eu-west-1.compute.internal.irdmi: Flags [S], seq 1128657991, win 64240, options [mss 1359,sackOK,TS val 2780916192 ecr 0,nop,wscale 7], length 0
09:38:07.331676 eni989c4ec4a56 Out IP ip-192-168-1-100.eu-west-1.compute.internal.41856 > ip-192-0-2-123.eu-west-1.compute.internal.irdmi: Flags [S], seq 1128657991, win 64240, options [mss 1359,sackOK,TS val 2780916192 ecr 0,nop,wscale 7], length 0
09:38:07.331696 eni989c4ec4a56 In  IP ip-192-0-2-123.eu-west-1.compute.internal.irdmi > ip-192-168-1-100.eu-west-1.compute.internal.41856: Flags [S.], seq 3367907264, ack 1128657992, win 26847, options [mss 8961,sackOK,TS val 1259768406 ecr 2780916192,nop,wscale 7], length 0
09:38:07.331702 eth0  Out IP ip-192-0-2-123.eu-west-1.compute.internal.irdmi > ip-192-168-1-100.eu-west-1.compute.internal.41856: Flags [S.], seq 3367907264, ack 1128657992, win 26847, options [mss 8961,sackOK,TS val 1259768406 ecr 2780916192,nop,wscale 7], length 0

The critical line here is the last one – it’s come in on eth1 and it’s going out of eth0. Another test here is to look at ip rule

[root@test-i-01234567890abcdef ~]# ip rule
0:	from all lookup local
512:	from all to 192.0.2.111 lookup main
512:	from all to 192.0.2.143 lookup main
512:	from all to 192.0.2.66 lookup main
512:	from all to 192.0.2.113 lookup main
512:	from all to 192.0.2.145 lookup main
512:	from all to 192.0.2.123 lookup main
512:	from all to 192.0.2.5 lookup main
512:	from all to 192.0.2.158 lookup main
512:	from all to 192.0.2.100 lookup main
512:	from all to 192.0.2.69 lookup main
512:	from all to 192.0.2.129 lookup main
1024:	from all fwmark 0x80/0x80 lookup main
1536:	from 192.0.2.123 lookup 2
32766:	from all lookup main
32767:	from all lookup default

Notice here that we have two entries from all to 192.0.2.123 lookup main and from 192.0.2.123 lookup 2. Let’s take a look at what lookup 2 gives us, in the routing table

[root@test-i-01234567890abcdef ~]# ip route show table 2
192.0.2.1 dev eth1 scope link

Fix the issue

This is pretty easy – we need to add a default route if one doesn’t already exist. Long before I got here, my boss created a script which first runs ip route show table main | grep default to get the gateway for that interface, then runs ip rule list, looks for each lookup <number> and finally runs ip route add to put the default route on that table, the same as on the main table.

ip route add default via "${GW}" dev "${INTERFACE}" table "${TABLE}"

Is this still needed?

I know when we upgraded our cluster from EKS1.23 to EKS1.27, this script was still needed. When I’ve just checked a worker running EKS1.31, after around 12 hours of running, and a second interface being up, it’s not been needed… so perhaps we can deprecate this script?

Dropping packets to the containers due to Martians

When we upgraded our cluster from EKS1.23 to EKS1.27 we also changed a lot of the infrastructure under the surface (AlmaLinux 9 from CentOS7, Containerd and Runc from Docker, CGroups v2 from CGroups v1, and so on). We also moved from using an AWS Elastic Load Balancer (ELB) or “Classic Load Balancer” to AWS Network Load Balancer (NLB).

Following the upgrade, we started seeing packets not arriving at our containers and the system logs on the node were showing a lot of martian source messages, particularly after we configured our NLB to forward original IP source addresses to the nodes.

What happens

One thing we noticed was that each time we added a new pod to the cluster, it added a new eni[0-9a-f]{11} interface, but the sysctl value for net.ipv4.conf.<interface>.rp_filter (return path filtering – basically, should we expect the traffic to be arriving at this interface for that source?) in sysctl was set to 1 or “Strict mode” where the source MUST be the coming from the best return path for the interface it arrived on. The AWS VPC-CNI is supposed to set this to 2 or “Loose mode” where the source must be reachable from any interface.

In this case you’d tell this because you’d see this in your system journal (assuming you’ve got net.ipv4.conf.all.log_martians=1 configured):

Dec 03 10:01:19 test-i-01234567890abcdef kernel: IPv4: martian source 192.168.1.100 from 192.0.2.123, on dev eth1

The net result is that packets would be dropped by the host at this point, and they’d never be received by the containers in the pods.

Fix the issue

This one is also pretty easy. We run sysctl -a and loop through any entries which match net.ipv4.conf.([^\.]+).rp_filter = (0|1) and then, if we find any, we run sysctl -w net.ipv4.conf.\1.rp_filter = 2 to set it to the correct value.

Is this still needed?

Yep, absolutely. As of our latest upgrade to EKS1.31, if this value isn’t set, then it will drop packets. VPC-CNI should be fixing this, but for some reason it doesn’t. And setting the conf.ipv4.all.rp_filter to 2 doesn’t seem to make a difference, which is contrary to the documentation in the relevant Kernel documentation.

After 12 IP addresses are assigned to a node, Kubernetes services stop working for some pods

This was pretty weird. When we upgraded to EKS1.31 on our smallest cluster we initially thought we had an issue with CoreDNS, in that it sometimes wouldn’t resolve IP addresses for services (DNS names for services inside the cluster are resolved by <servicename>.<namespace>.svc.cluster.local to an internal IP address for the cluster – in our case, in the range 172.20.0.0/16). We upgraded CoreDNS to the EKS1.31 recommended version, v1.11.3-eksbuild.2 and that seemed to fix things… until we upgraded our next largest cluster, and things REALLY went wrong, but only when we had increased to over 12 IP addresses assigned to the node.

You might see this as frequent restarts of a container, particularly if you’re reliant on another service to fulfil an init container or the liveness/readyness check.

What happens

EKS1.31 moves KubeProxy from iptables or ipvs mode to nftables – a shift we had to make internally as AlmaLinux 9 no longer supports iptables mode, and ipvs is often quite flaky, especially when you have a lot of pod movements.

With a single interface and up to 11 IP addresses assigned to that interface, everything runs fine, but the moment we move to that second interface, much like in the first case above, we start seeing those pods attached to the second+ interface being unable to resolve service addresses. On further investigation, doing a dig from a container inside that pod to the service address of the CoreDNS service 172.20.0.10 would timeout, but a dig against the actual pod address 192.0.2.53 would return a valid response.

Under the surface, on each worker, KubeProxy adds a rule to nftables to say “if you try and reach 172.20.0.10, please instead direct it to 192.0.2.53”. As the containers fluctuate inside the cluster, KubeProxy is constantly re-writing these rules. For whatever reason though, KubeProxy currently seems unable to determine that a second or subsequent interface has been added, and so these rules are not applied to the pods attached to that interface…. or at least, that’s what it looks like!

Fix the issue

In this case, we wrote a separate script which was also triggered every minute. This script looks to see if the interfaces have changed by running ip link and looking for any interfaces called eth[0-9]+ which have changed, and then if it has, it runs crictl pods (which lists all the running pods in Containerd), looks for the Pod ID of KubeProxy, and then runs crictl stopp <podID> [1] and crictl rmp <podID> [1] to stop and remove the pod, forcing kubelet to restart the KubeProxy on the node.

[1] Yes, they aren’t typos, stopp means “stop the pod” and rmp means “remove the pod”, and these are different to stop and rm which relate to the container.

Is this still needed?

As this was what I was working on all-day yesterday, yep, I’d say so 😊 – in all seriousness though, if this hadn’t been a high-priority issue on the cluster, I might have tried to upgrade the AWS VPC-CNI and KubeProxy add-ons to a later version, to see if the issue was resolved, but at this time, we haven’t done that, so maybe I’ll issue a retraction later πŸ˜‚

Featured image is β€œApoptosis Network (alternate)” by β€œSimon Cockell” on Flickr and is released under a CC-BY license.

Talk Summary – OggCamp ’24 – Kubernetes, A Guide for Docker users

Format: Theatre Style room. ~30 attendees.

Slides: Available to view (Firefox/Chrome recommended – press β€œS” to see the required speaker notes)

Video: Not recorded. I’ll try to record it later, if I get a chance.

Slot: Graphine 1, 13:30-14:00

Notes: Apologies for the delay on posting this summary. The talk was delivered to a very busy room. Lots of amazing questions. The presenter notes were extensive, but entirely unused when delivered. One person asked a question, I said I’d follow up with them later, but didn’t find them before the end of the conference. One person asked about the benefits of EKS over ECS in AWS… as I’ve not used ECS, I couldn’t answer, but it sounds like they largely do the same thing.

An open padlock with a key inserted into it, on a printed circuit board

Pulling container images from private registries (including Docker Hub) with a Kubernetes Kubelet Credential Provider

At work last week, I finally solved an issue by writing some code, and I wanted to explain why I wrote it.

At it’s core, Kubernetes is an orchestrator which runs “Container Images”, which are structured filesystem snapshots, taken after running individual commands against a base system. These container images are stored in a container registry, and the most well known of these is the Docker registry, known as Docker Hub.

A registry can be public, meaning you don’t need credentials to get any images from it, or private. Some also offer a mixed-mode where you can make a certain number of requests without requiring authentication, but if you need more than that amount of requests, you need to provide credentials.

During the build-out of a new cluster, I discovered that the ECR (Elastic Container Registry) from AWS requires a new type of authentication – the Kubelet Credential Provider, which required the following changes:

  1. In /etc/sysconfig/kubelet you provide these two switches;
    --image-credential-provider-bin-dir /usr/local/bin/image-credential-provider and --image-credential-provider-config /etc/kubernetes/image-credential-provider-config.json.
  2. In /etc/kubernetes/image-credential-provider-config.json you provide a list of registries and the credential provider to use, which looks like this:
{
  "apiVersion": "kubelet.config.k8s.io/v1",
  "kind": "CredentialProviderConfig",
  "providers": [
    {
      "name": "binary-credential-provider-name",
      "matchImages": [
        "example.org",
        "registry.*.example.org",
        "*.registry.*.example.org"
      ],
      "defaultCacheDuration": "12h",
      "apiVersion": "credentialprovider.kubelet.k8s.io/v1"
    }
  ]
}
  1. Downloading and placing the credential provider binary into the /usr/local/bin/image-credential-provider path.

The ECR Credential Provider has it’s own Github repostitory, and it made me think – we’ve been using the “old” method of storing credentials using the containerd configuration file, which is now marked as deprecated – but this means that any changes to these credentials would require a restart of the containerd service (which apparently used to have a big impact on the platform), but this new ECR provider doesn’t.

I decided to write my own Credential Provider, following the documentation for the Kubelet Credential Provider API and I wrote it in Python – a language I’m trying to get better in! (Pull requests, feature requests, etc. are all welcome!)

I will confess I made heavy use of ChatGPT to get a steer on certain aspects of how to write the code, but all the code is generic and there’s nothing proprietary in this code.

Using the Generic Credential Provider

  1. Follow the steps above – change your Kubernetes environment to ensure you have the kubelet configuration changes and the JSON credential provider configuration put in the relevant parts of your tree. Set the “matchImages” values to include the registry in question – for dockerhub, I’d probably use ["docker.io", "*.docker.io"]
  2. Download the generic-credential-provider script from Github, put it in the right path in your worker node’s filesystem (if you followed my notes above it’ll be in /usr/local/bin/image-credential-provider/generic-credential-provider but this is *your* system we’re talking about, not mine! You know your build better than I do!)
  3. Create the /etc/kubernetes/registries directory – this can be changed by editing the script to use a new path, and for testing purposes there is a flag --credroot /some/new/path but that doesn’t work for the kubelet configuration file.
  4. Create a credential file, for example, /etc/kubernetes/registries/example.org.json which contains this string: {"username":"token_username","password":"token_password"}. [Yes, it’s a plaintext credential. Make sure it’s scoped for only image downloads. No, this still isn’t very good. But how else would you do this?! (Pull requests are welcomed!)] You can add a duration value into that JSON dictionary, to change the default timeout from 5 minutes. Technically, the default is actually set in /etc/kubernetes/image-credential-provider-config.json but I wanted to have my own per-credential, and as these values are coming from the filesystem, and therefore has very little performance liability, I didn’t want to have a large delay in the cache.
  5. Test your credential! This code is what I used:
echo '{
  "apiVersion": "credentialprovider.kubelet.k8s.io/v1",
  "kind": "CredentialProviderRequest",
  "image": "your.registry.example.org/org/image:version"
}' | /usr/local/bin/image-credential-provider/generic-credential-provider

which should return:

'{"kind": "CredentialProviderResponse", "apiVersion": "credentialprovider.kubelet.k8s.io/v1", "cacheKeyType": "Registry", "cacheDuration": "0h5m0s", "auth": {"your.registry.example.com": {"username": "token_username", "password": "token_password"}}}'

You should also see an entry in your syslog service showing a line that says “Credential request fulfilled for your.registry.example.com” and if you pass it a check that it fails, it should say “Failed to fulfill credential request for failure.example.org“.

If this helped you, please consider buying me a drink to say thanks!

Featured image is β€œPadlock on computer parts” by β€œMarco Verch Professional Photographer” on Flickr and is released under a CC-BY license.

A medieval helm in gold on a bench at a museum

Fixing 403 errors from ghcr.io with #helm pull

At work, I’m using skaffold to deploy a helm chart which references a ghcr.io repository. Here’s the stanza I’m looking at:

apiVersion: skaffold/v3
kind: Config
deploy:
  helm:
    releases:
      - name: {package}
        remoteChart: oci://ghcr.io/{owner}/{package}

This is the first time I’ve tried to deploy this chart, and I kept getting this message:

No tags generated
Starting test...
Starting deploy...
Helm release {package} not installed. Installing...
Error: INSTALLATION FAILED: failed to authorize: failed to fetch anonymous token: unexpected status from GET request to https://ghcr.io/token?scope=repository%3A{owner}%2F{package}%3Apull&scope=repository%3Auser%2Fimage%3Apull&service=ghcr.io: 403 Forbidden
deploying "{package}": install: exit status 1

I thought this might have been an issue with the skaffold file, so I tried running this directly with helm:

$ helm pull oci://ghcr.io/{owner}/{package}
Error: failed to authorize: failed to fetch anonymous token: unexpected status from GET request to https://ghcr.io/token?scope=repository%3A{owner}%2F{package}%3Apull&scope=repository%3Auser%2Fimage%3Apull&service=ghcr.io: 403 Forbidden

Huh, that looks a bit familiar. I spent a little while checking to see whether this was something at the Kubernetes cluster, or if it was just me, and ended up finding this nugget (thanks to a steer from this post)

$ gh auth token | helm registry login ghcr.io -u {my_github_user} --password-stdin
Login Succeeded

And now it works!

elm pull oci://ghcr.io/{owner}/{package}
Pulled: ghcr.io/{owner}/{package}:1.2.3
Digest: sha256:decafbad1234567890aabbccddeeffdeadbeefbadbadbadbad12345678901234

Featured image is β€œhelm” by β€œ23 dingen voor musea” on Flickr and is released under a CC-BY-SA license.

"Honey pots" by "Nicholas" on Flickr

Adding MITM (or “Trusted Certificate Authorities”) proxy certificates for Linux and Linux-like Environments

In some work environments, you may find that a “Man In The Middle” (also known as MITM) proxy may have been configured to inspect HTTPS traffic. If you work in a predominantly Windows based environment, you may have had some TLS certificates deployed to your computer when you logged in, or by group policy.

I’ve previously mentioned that if you’re using Firefox on your work machines where you’ve had these certificates pushed to your machine, then you’ll need to enable a configuration flag to make those work under Firefox (“security.enterprise_roots.enabled“), but this is talking about Linux (like Ubuntu, Fedora, CentOS, etc.) and Linux-like environments (like WSL, MSYS2)

Late edit 2021-05-06: Following a conversation with SiDoyle, I added some notes at the end of the post about using the System CA path with the Python Requests library. These notes were initially based on a post by Mohclips from several years ago!

Start with Windows

From your web browser of choice, visit any HTTPS web page that you know will be inspected by your proxy.

If you’re using Mozilla Firefox

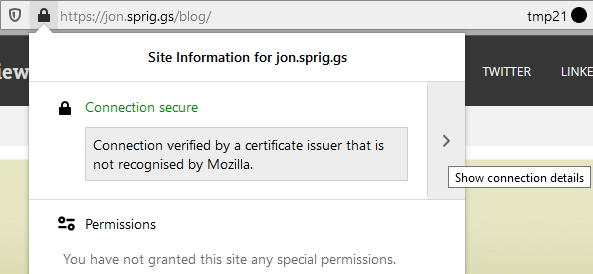
In Firefox, click on this part of the address bar and click on the right arrow next to “Connection secure”:

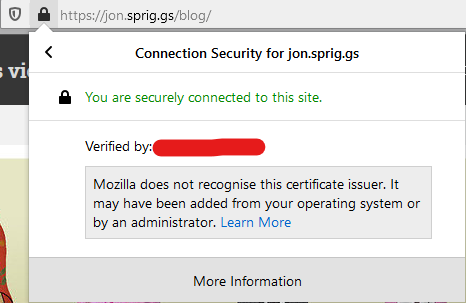
Clicking on the Padlock and then clicking on the Right arrow will take you to the “Connection Security” screen.
Certification Root obscured, but this where we prove we have a MITM certificate.

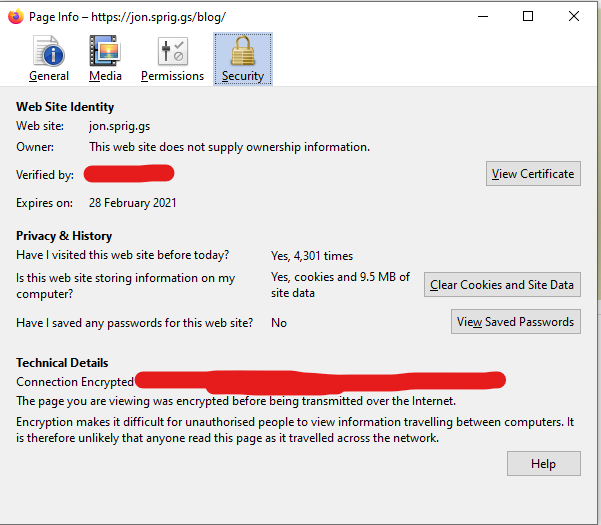
Click on “More Information” to take you to the “Page info” screen

More obscured details, but click on “View Certificate”

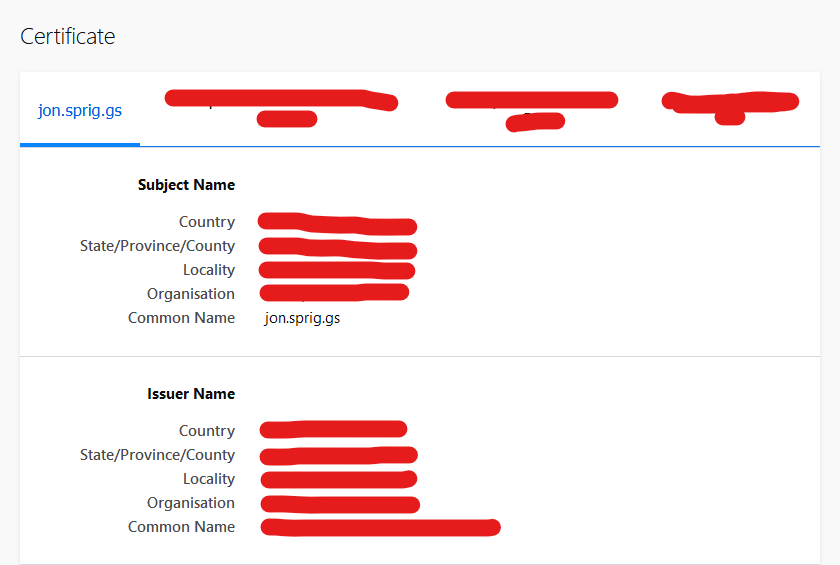
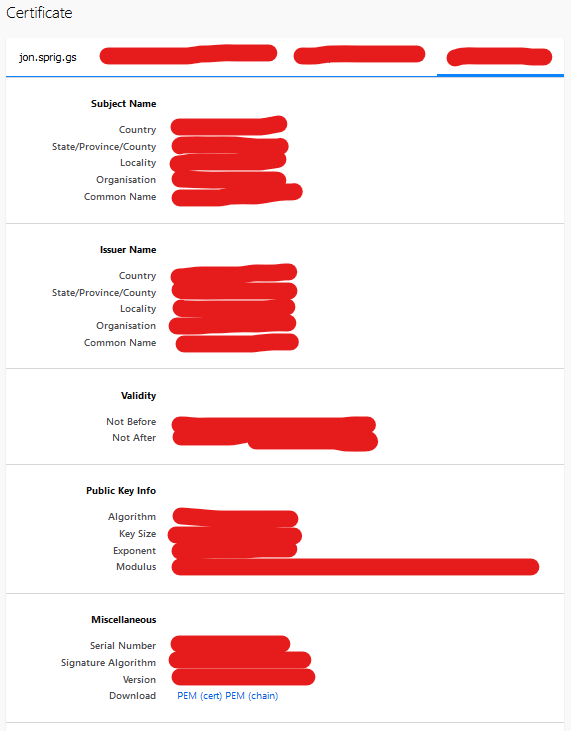
In recent versions of Firefox, clicking on “View Certificate” takes you to a new page which looks like this:

Mammoth amounts of obscuring here! The chain runs from left to right, with the right-most blob being the Root Certificate

Click on the right-most tab of this screen, and navigate down to where it says “Miscellaneous”. Click on the link to download the “PEM (cert)”.

The details on the Certificate Authority (highly obscured!), but here is where we get our “Root” Certificate for this proxy.

Save this certificate somewhere sensible, we’ll need it in a bit!

Note that if you’ve got multiple proxies (perhaps for different network paths, or perhaps for a cloud proxy and an on-premises proxy) you might need to force yourself in into several situations to get these.

If you’re using Google Chrome / Microsoft Edge

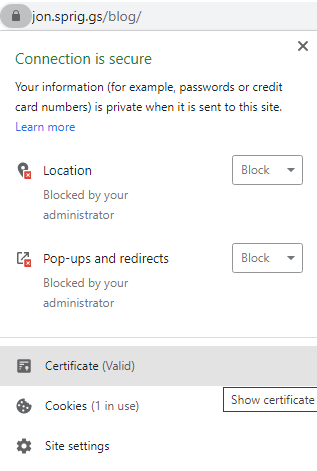
In Chrome or Edge, click on the same area, and select “Certificate”:

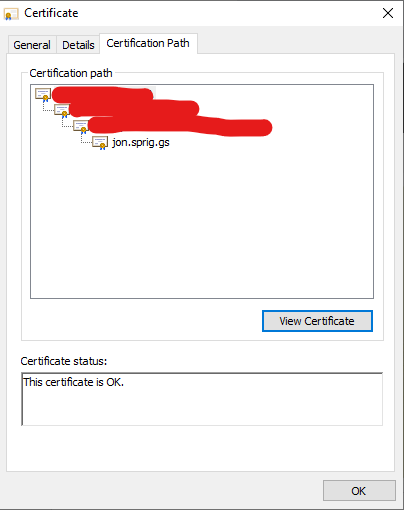
This will take you to a screen listing the “Certification Path”. This is the chain of trust between the “Root” certificate for the proxy to the certificate they issue so I can visit my website:

This screen shows the chain of trust from the top of the chain (the “Root” certificate) to the bottom (the certificate they issued so I could visit this website)

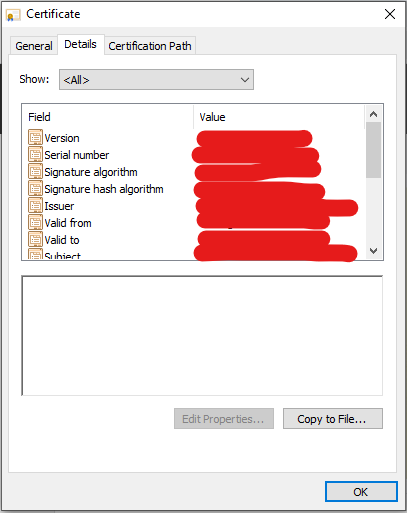
Click on the topmost line of the list, and then click “View Certificate” to see the root certificate. Click on “Details”:

The (obscured) details for the root CA.

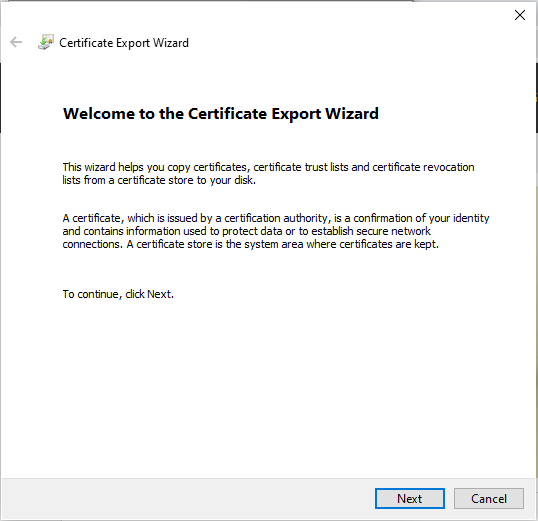
Click on “Copy to File” to open the “Certificate Export Wizard”:

In the Certificate Export Wizard, click “Next”
Select “Base-64 encoded X.509 (.CER)” and click “Next”
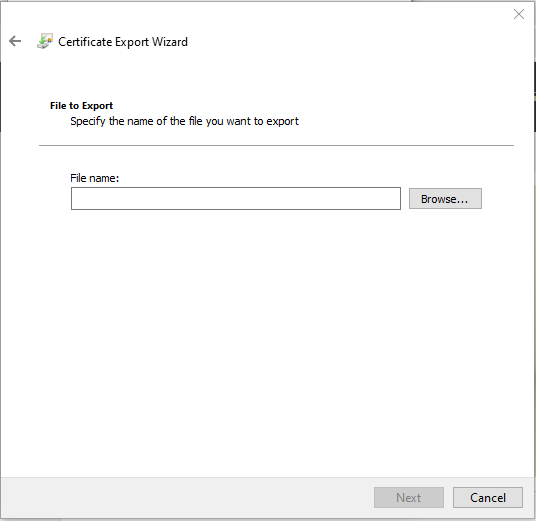
Click on the “Browse…” button to select a path.
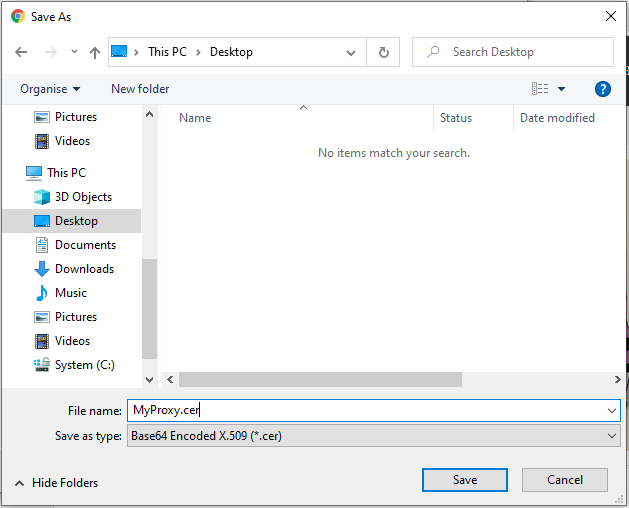
Name the file something sensible, and put the file somewhere you’ll find it shortly. Click “Save”, then click “Next”.

Once you’ve saved this file, rename it to have the extension .pem. You may need to do this from a command line!

Copy the certificate into the environment and add it to the system keychain

Ubuntu or Debian based systems as an OS, or as a WSL environment

As root, copy the proxy’s root key into /usr/local/share/ca-certificates/<your_proxy_name>.crt (for example, /usr/local/share/ca-certificates/proxy.my.corp.crt) and then run update-ca-certificates to update the system-wide certificate store.

RHEL/CentOS as an OS, or as a WSL environment

As root, copy the proxy’s root key into /etc/pki/ca-trust/source/anchors/<your_proxy_name>.pem (for example, /etc/pki/ca-trust/source/anchors/proxy.my.corp.pem) and then run update-ca-trust to update the system-wide certificate store.

MSYS2 or the Ruby Installer

Open the path to your MSYS2 environment (e.g. C:\Ruby30-x64\msys64) using your file manager (Explorer) and run msys2.exe. Then paste the proxy’s root key into the etc/pki/ca-trust/source/anchors subdirectory, naming it <your_proxy_name>.pem. In the MSYS2 window, run update-ca-trust to update the environment-wide certificate store.

If you’ve obtained the Ruby Installer from https://rubyinstaller.org/ and installed it from there, assuming you accepted the default path of C:\Ruby<VERSION>-x64 (e.g. C:\Ruby30-x64) you need to perform the above step (running update-ca-trust) and then copy the file from C:\Ruby30-x64\mysys64\etc\pki\ca-trust\extracted\pem\tls-ca-bundle.pem to C:\Ruby30-x64\ssl\cert.pem

Using the keychain

Most of your Linux and Linux-Like environments will operate fine with this keychain, but for some reason, Python needs an environment variable to be passed to it for this. As I encounter more environments, I’ll update this post!

The path to the system keychain varies between releases, but under Debian based systems, it is: /etc/ssl/certs/ca-certificates.crt while under RedHat based systems, it is: /etc/pki/tls/certs/ca-bundle.crt.

Python “Requests” library

If you’re getting TLS errors in your Python applications, you need the REQUESTS_CA_BUNDLE environment variable set to the path for the system-wide keychain. You may want to add this line to your /etc/profile to include this path.

Sources:

Featured image is β€œHoney pots” by β€œNicholas” on Flickr and is released under a CC-BY license.

"So many coats..." by "Scott Griggs" on Flickr

Migrating from docker-compose to Kubernetes Files

Just so you know. This is a long article to explain my wandering path through understanding Kubernetes (K8S). It’s not an article to explain to you how to use K8S with your project. I hit a lot of blockers, due to the stack I’m using and I document them all. This means there’s a lot of noise and not a whole lot of Signal.

In a previous blog post I created a docker-compose.yml file for a PHP based web application. Now that I have a working Kubernetes environment, I wanted to port the configuration files into Kubernetes.

Initially, I was pointed at Kompose, a tool for converting docker-compose files to Kubernetes YAML formatted files, and, in fact, this gives me 99% of what I need… except, the current version uses beta API version flags for some of it’s outputted files, and this isn’t valid for the version of Kubernetes I’m running. So, let’s wind things back a bit, and find out what you need to do to use kompose first and then we can tweak the output file next.

Note: I’m running all these commands as root. There’s a bit of weirdness going on because I’m using the snap of Docker and I had a few issues with running these commands as a user… While I could have tried to get to the bottom of this with sudo and watching logs, I just wanted to push on… Anyway.

Here’s our “simple” docker-compose file.

version: '3'
services:
  db:
    build:
      context: .
      dockerfile: mariadb/Dockerfile
    image: localhost:32000/db
    restart: always
    environment:
      MYSQL_ROOT_PASSWORD: a_root_pw
      MYSQL_USER: a_user
      MYSQL_PASSWORD: a_password
      MYSQL_DATABASE: a_db
    expose:
      - 3306
  nginx:
    build:
      context: .
      dockerfile: nginx/Dockerfile
    image: localhost:32000/nginx
    ports:
      - 1980:80
  phpfpm:
    build:
      context: .
      dockerfile: phpfpm/Dockerfile
    image: localhost:32000/phpfpm

This has three components – the MariaDB database, the nginx web server and the PHP-FPM CGI service that nginx consumes. The database service exposes a port (3306) to other containers, with a set of hard-coded credentials (yep, that’s not great… working on that one!), while the nginx service opens port 1980 to port 80 in the container. So far, so … well, kinda sensible :)

If we run kompose convert against this docker-compose file, we get five files created; db-deployment.yaml, nginx-deployment.yaml, phpfpm-deployment.yaml, db-service.yaml and nginx-service.yaml. If we were to run kompose up on these, we get an error message…

Well, actually, first, we get a whole load of “INFO” and “WARN” lines up while kompose builds and pushes the containers into the MicroK8S local registry (a registry is a like a package repository, for containers), which is served by localhost:32000 (hence all the image: localhost:3200/someimage lines in the docker-compose.yml file), but at the end, we get (today) this error:

INFO We are going to create Kubernetes Deployments, Services and PersistentVolumeClaims for your Dockerized application. If you need different kind of resources, use the 'kompose convert' and 'kubectl create -f' commands instead.

FATA Error while deploying application: Get http://localhost:8080/api: dial tcp 127.0.0.1:8080: connect: connection refused

Uh oh! Well, this is a known issue at least! Kubernetes used to use, by default, http on port 8080 for it’s service, but now it uses https on port 6443. Well, that’s what I thought! In this issue on the MicroK8S repo, it says that it uses a different port, and you should use microk8s.kubectl cluster-info to find the port… and yep… Kubernetes master is running at https://127.0.0.1:16443. Bah.

root@microk8s-a:~/glowing-adventure# microk8s.kubectl cluster-info
Kubernetes master is running at https://127.0.0.1:16443
Heapster is running at https://127.0.0.1:16443/api/v1/namespaces/kube-system/services/heapster/proxy
CoreDNS is running at https://127.0.0.1:16443/api/v1/namespaces/kube-system/services/kube-dns:dns/proxy
Grafana is running at https://127.0.0.1:16443/api/v1/namespaces/kube-system/services/monitoring-grafana/proxy
InfluxDB is running at https://127.0.0.1:16443/api/v1/namespaces/kube-system/services/monitoring-influxdb:http/proxy

So, we export the KUBERNETES_MASTER environment variable, which was explained in that known issue I mentioned before, and now we get a credential prompt:

Please enter Username:

Oh no, again! I don’t have credentials!! Fortunately the MicroK8S issue also tells us how to find those! You run microk8s.config and it tells you the username!

roo@microk8s-a:~/glowing-adventure# microk8s.config
apiVersion: v1
clusters:
- cluster:
    certificate-authority-data: <base64-data>
    server: https://10.0.2.15:16443
  name: microk8s-cluster
contexts:
- context:
    cluster: microk8s-cluster
    user: admin
  name: microk8s
current-context: microk8s
kind: Config
preferences: {}
users:
- name: admin
  user:
    username: admin
    password: QXdUVmN3c3AvWlJ3bnRmZVJmdFhpNkJ3cDdkR3dGaVdxREhuWWo0MmUvTT0K

So, our username is “admin” and our password is … well, in this case a string starting QX and ending 0K but yours will be different!

We run kompose up again, and put in the credentials… ARGH!

FATA Error while deploying application: Get https://127.0.0.1:16443/api: x509: certificate signed by unknown authority

Well, now, that’s no good! Fortunately, a quick Google later, and up pops this Stack Overflow suggestion (mildly amended for my circumstances):

openssl s_client -showcerts -connect 127.0.0.1:16443 < /dev/null | sed -ne '/-BEGIN CERTIFICATE-/,/-END CERTIFICATE-/p' | sudo tee /usr/local/share/ca-certificates/k8s.crt
update-ca-certificates
systemctl restart snap.docker.dockerd

Right then. Let’s run that kompose up statement again…

INFO We are going to create Kubernetes Deployments, Services and PersistentVolumeClaims for your Dockerized application. If you need different kind of resources, use the 'kompose convert' and 'kubectl create -f' commands instead.

Please enter Username: 
Please enter Password: 
INFO Deploying application in "default" namespace
INFO Successfully created Service: nginx
FATA Error while deploying application: the server could not find the requested resource

Bah! What resource do I need? Well, actually, there’s a bug in 1.20.0 of Kompose, and it should be fixed in 1.21.0. The “resource” it’s talking about is, I think, that one of the APIs refuses to process the converted YAML files. As a result, the “resource” is the service that won’t start. So, instead, let’s convert the file into the output YAML files, and then take a peak at what’s going wrong.

root@microk8s-a:~/glowing-adventure# kompose convert
INFO Kubernetes file "nginx-service.yaml" created
INFO Kubernetes file "db-deployment.yaml" created
INFO Kubernetes file "nginx-deployment.yaml" created
INFO Kubernetes file "phpfpm-deployment.yaml" created

So far, so good! Now let’s run kubectl apply with each of these files.

root@microk8s-a:~/glowing-adventure# kubectl apply -f nginx-service.yaml
Warning: kubectl apply should be used on resource created by either kubectl create --save-config or kubectl apply
service/nginx configured
root@microk8s-a:~# kubectl apply -f nginx-deployment.yaml
error: unable to recognize "nginx-deployment.yaml": no matches for kind "Deployment" in version "extensions/v1beta1"

Apparently the service files are all OK, the problem is in the deployment files. Hmm OK, let’s have a look at what could be wrong. Here’s the output file:

root@microk8s-a:~/glowing-adventure# cat nginx-deployment.yaml
apiVersion: extensions/v1beta1
kind: Deployment
metadata:
  annotations:
    kompose.cmd: kompose convert
    kompose.version: 1.20.0 (f3d54d784)
  creationTimestamp: null
  labels:
    io.kompose.service: nginx
  name: nginx
spec:
  replicas: 1
  strategy: {}
  template:
    metadata:
      annotations:
        kompose.cmd: kompose convert
        kompose.version: 1.20.0 (f3d54d784)
      creationTimestamp: null
      labels:
        io.kompose.service: nginx
    spec:
      containers:
      - image: localhost:32000/nginx
        name: nginx
        ports:
        - containerPort: 80
        resources: {}
      restartPolicy: Always
status: {}

Well, the extensions/v1beta1 API version doesn’t seem to support “Deployment” options any more, so let’s edit it to change that to what the official documentation example shows today. We need to switch to using the apiVersion: apps/v1 value. Let’s see what happens when we make that change!

root@microk8s-a:~/glowing-adventure# kubectl apply -f nginx-deployment.yaml
error: error validating "nginx-deployment.yaml": error validating data: ValidationError(Deployment.spec): missing required field "selector" in io.k8s.api.apps.v1.DeploymentSpec; if you choose to ignore these errors, turn validation off with --validate=false

Hmm this seems to be a fairly critical issue. A selector basically tells the orchestration engine which images we want to be deployed. Let’s go back to the official example. So, we need to add the “selector” value in the “spec” block, at the same level as “template”, and it needs to match the labels we’ve specified. It also looks like we don’t need most of the metadata that kompose has given us. So, let’s adjust the deployment to look a bit more like that example.

root@microk8s-a:~/glowing-adventure# cat nginx-deployment.yaml
apiVersion: apps/v1
kind: Deployment
metadata:
  labels:
    app: nginx
  name: nginx
spec:
  replicas: 1
  selector:
    matchLabels:
      app: nginx
  template:
    metadata:
      labels:
        app: nginx
    spec:
      containers:
      - image: localhost:32000/nginx
        name: nginx
        ports:
        - containerPort: 80
        resources: {}
      restartPolicy: Always

Fab. And what happens when we run it?

root@microk8s-a:~/glowing-adventure# kubectl apply -f nginx-deployment.yaml
deployment.apps/nginx created

Woohoo! Let’s apply all of these now.

root@microk8s-a:~/glowing-adventure# for i in db-deployment.yaml nginx-deployment.yaml nginx-service.yaml phpfpm-deployment.yaml; do kubectl apply -f $i ; done
deployment.apps/db created
deployment.apps/nginx unchanged
service/nginx unchanged
deployment.apps/phpfpm created

Oh, hang on a second, that service (service/nginx) is unchanged, but we changed the label from io.kompose.service: nginx to app: nginx, so we need to fix that. Let’s open it up and edit it!

apiVersion: v1
kind: Service
metadata:
  annotations:
    kompose.cmd: kompose convert
    kompose.version: 1.20.0 (f3d54d784)
  creationTimestamp: null
  labels:
    io.kompose.service: nginx
  name: nginx
spec:
  ports:
  - name: "1980"
    port: 1980
    targetPort: 80
  selector:
    io.kompose.service: nginx
status:
  loadBalancer: {}

Ah, so this has the “annotations” field too, in the metadata, and, as suspected, it’s got the io.kompose.service label as the selector. Hmm OK, let’s fix that.

root@microk8s-a:~/glowing-adventure# cat nginx-service.yaml
apiVersion: v1
kind: Service
metadata:
  labels:
    app: nginx
  name: nginx
spec:
  ports:
  - name: "1980"
    port: 1980
    targetPort: 80
  selector:
    app: nginx
status:
  loadBalancer: {}

Much better. And let’s apply it…

root@microk8s-a:~/glowing-adventure# kubectl apply -f nginx-service.yaml
service/nginx configured

Fab! So, let’s review the state of the deployments, the services, the pods and the replication sets.

root@microk8s-a:~/glowing-adventure# kubectl get deploy
NAME     READY   UP-TO-DATE   AVAILABLE   AGE
db       1/1     1            1           8m54s
nginx    0/1     1            0           8m53s
phpfpm   1/1     1            1           8m48s

Hmm. That doesn’t look right.

root@microk8s-a:~/glowing-adventure# kubectl get pod
NAME                      READY   STATUS             RESTARTS   AGE
db-f78f9f69b-grqfz        1/1     Running            0          9m9s
nginx-7774fcb84c-cxk4v    0/1     CrashLoopBackOff   6          9m8s
phpfpm-66945b7767-vb8km   1/1     Running            0          9m3s
root@microk8s-a:~# kubectl get rs
NAME                DESIRED   CURRENT   READY   AGE
db-f78f9f69b        1         1         1       9m18s
nginx-7774fcb84c    1         1         0       9m17s
phpfpm-66945b7767   1         1         1       9m12s

Yep. What does “CrashLoopBackOff” even mean?! Let’s check the logs. We need to ask the pod itself, not the deployment, so let’s use the kubectl logs command to ask.

root@microk8s-a:~/glowing-adventure# kubectl logs nginx-7774fcb84c-cxk4v
2020/01/17 08:08:50 [emerg] 1#1: host not found in upstream "phpfpm" in /etc/nginx/conf.d/default.conf:10
nginx: [emerg] host not found in upstream "phpfpm" in /etc/nginx/conf.d/default.conf:10

Hmm. That’s not good. We were using the fact that Docker just named everything for us in the docker-compose file, but now in Kubernetes, we need to do something different. At this point I ran out of ideas. I asked on the McrTech slack for advice. I was asked to run this command, and would you look at that, there’s nothing for nginx to connect to.

root@microk8s-a:~/glowing-adventure# kubectl get service
NAME         TYPE        CLUSTER-IP      EXTERNAL-IP   PORT(S)    AGE
kubernetes   ClusterIP   10.152.183.1    <none>        443/TCP    24h
nginx        ClusterIP   10.152.183.62   <none>        1980/TCP   9m1s

It turns out that I need to create a service for each of the deployments. So, now I have a separate service for each one. I copied the nginx-service.yaml file into db-service.yaml and phpfpm-service.yaml, edited the files and now… tada!

root@microk8s-a:~/glowing-adventure# kubectl get service
NAME         TYPE        CLUSTER-IP      EXTERNAL-IP   PORT(S)    AGE
db           ClusterIP   10.152.183.61   <none>        3306/TCP   5m37s
kubernetes   ClusterIP   10.152.183.1    <none>        443/TCP    30h
nginx        ClusterIP   10.152.183.62   <none>        1980/TCP   5h54m
phpfpm       ClusterIP   10.152.183.69   <none>        9000/TCP   5m41s

But wait… How do I actually address nginx now? Huh. No external-ip (not even “pending”, which is what I ended up with), no ports to talk to. Uh oh. Now I need to understand how to hook this service up to the public IP of this node. Ahh, see up there it says “ClusterIP”? That means “this service is only available INSIDE the cluster”. If I change this to “NodePort” or “LoadBalancer”, it’ll attach that port to the external interface.

What’s the difference between “NodePort” and “LoadBalancer”? Well, according to this page, if you are using a managed Public Cloud service that supports an external load balancer, then putting this to “LoadBalancer” should attach your “NodePort” to the provider’s Load Balancer automatically. Otherwise, you need to define the “NodePort” value in your config (which must be a value between 30000 and 32767, although that is configurable for the node). Once you’ve done that, you can hook your load balancer up to that port, for example Client -> Load Balancer IP (TCP/80) -> K8S Cluster IP (e.g. TCP/31234)

So, how does this actually look. I’m going to use the “LoadBalancer” option, because if I ever deploy this to “live”, I want it to integrate with the load balancer, but for now, I can cope with addressing a “high port”. Right, well, let me open back up that nginx-service.yaml, and make the changes.

root@microk8s-a:~/glowing-adventure# cat nginx-service.yaml
apiVersion: v1
kind: Service
metadata:
  labels:
    app: nginx
  name: nginx
spec:
  type: LoadBalancer
  ports:
  - name: nginx
    nodePort: 30000
    port: 1980
    targetPort: 80
  selector:
    app: nginx
status:
  loadBalancer: {}

The key parts here are the lines type: LoadBalancer and nodePort: 30000 under spec: and ports: respectively. Note that I can use, at this point type: LoadBalancer and type: NodePort interchangably, but, as I said, if you were using this in something like AWS or Azure, you might want to do it differently!

So, now I can curl http://192.0.2.100:30000 (where 192.0.2.100 is the address of my “bridged interface” of K8S environment) and get a response from my PHP application, behind nginx, and I know (from poking at it a bit) that it works with my Database.

OK, one last thing. I don’t really want lots of little files which have got config items in. I quite liked the docker-compose file as it was, because it had all the services in as one block, and I could run “docker-compose up”, but the kompose script split it out into lots of pieces. In Kubernetes, if the YAML file it loads has got a divider in it (a line like this: ---) then it stops parsing it at that point, and starts reading the file after that as a new file. Like this I could have the following layout:

apiVersion: apps/v1
kind: Deployment
more: stuff
---
apiVersion: v1
kind: Service
more: stuff
---
apiVersion: apps/v1
kind: Deployment
more: stuff
---
apiVersion: v1
kind: Service
more: stuff

But, thinking about it, I quite like having each piece logically together, so I really want db.yaml, nginx.yaml and phpfpm.yaml, where each of those files contains both the deployment and the service. So, let’s do that. I’ll do one file, so it makes more sense, and then show you the output.

root@microk8s-a:~/glowing-adventure# mkdir -p k8s
root@microk8s-a:~/glowing-adventure# mv db-deployment.yaml k8s/db.yaml
root@microk8s-a:~/glowing-adventure# echo "---" >> k8s/db.yaml
root@microk8s-a:~/glowing-adventure# cat db-service.yaml >> k8s/db.yaml
root@microk8s-a:~/glowing-adventure# rm db-service.yaml
root@microk8s-a:~/glowing-adventure# cat k8s/db.yaml
apiVersion: apps/v1
kind: Deployment
metadata:
  labels:
    app: db
  name: db
spec:
  replicas: 1
  selector:
    matchLabels:
      app: db
  template:
    metadata:
      labels:
        app: db
    spec:
      containers:
      - env:
        - name: MYSQL_DATABASE
          value: a_db
        - name: MYSQL_PASSWORD
          value: a_password
        - name: MYSQL_ROOT_PASSWORD
          value: a_root_pw
        - name: MYSQL_USER
          value: a_user
        image: localhost:32000/db
        name: db
        resources: {}
      restartPolicy: Always
---
apiVersion: v1
kind: Service
metadata:
  labels:
    app: db
  name: db
spec:
  ports:
  - name: mariadb
    port: 3306
    targetPort: 3306
  selector:
    app: db
status:
  loadBalancer: {}

So, now, if I do kubectl apply -f k8s/db.yaml I’ll get this output:

root@microk8s-a:~/glowing-adventure# kubectl apply -f k8s/db.yaml
deployment.apps/db unchanged
service/db unchanged

You can see the final files in the git repo for this set of tests.

Next episode, I’ll start looking at making my application scale (as that’s the thing that Kubernetes is known for) and having more than one K8S node to house my K8S pods!

Featured image is “So many coats…” by “Scott Griggs” on Flickr and is released under a CC-BY-ND license.

"Captain" by "The Laddie" on Flickr

Trying out Kubernetes (K8S) with MicroK8S in Vagrant

I’m going on a bit of a containers kick at the moment, and just recently I wanted to give Kubernetes (sometimes abbreviated to “K8S”) a try.

Kubernetes is an orchestration engine for Containers, like Docker. It’s designed to take the images that Docker (and other similar tools) produce, and run them across multiple nodes. You need to have a handle on how Docker works before giving K8S a try, but once you do, it’s well worth a shot to understand K8S.

Unlike Docker, K8S is a bit more in-depth on it’s requirements, and often people are pointed at Minikube as their introduction to K8S, however, my colleague and friend Nick suggested I might be better off with MicroK8S.

MicroK8S is an application released by Canonical as a Snap. A Snap is a Linux packaging format, similar to FlatPak and AppImage. It’s mostly used on Ubuntu based operating systems, but can also work on other Linux distributions.

I had an initial, failed, punt with the recommended advice for using MicroK8S on Windows (short story, Hyper-V did not work for me, and the VirtualBox back-end doesn’t expose any network ports, or at least, if it does, I couldn’t see how to make it work), and as I’m reasonably confident in using Vagrant work in Windows, I built a Vagrantfile to deliver MicroK8S.

To use this, you need Vagrant and VirtualBox, and then get the Vagrantfile from repo… then run vagrant up (it will ask you what interface you want to “bridge” to – this will be how you access the Kubernetes pods and Docker containers). Once the machine has finished building, you can run vagrant ssh to connect into it. From here, you can run your kubectl commands, as well as docker commands.

If you want to experiment with a multi-node environment, then I also built a Vagrantfile to deliver two virtual machines, both running MicroK8S, and used the shared storage element of Vagrant to transfer the “join” instruction from the first node to the second.

Of course, now I just need to work out how the hell I do Kubernetes 🀣

Featured image is “Captain” by “The Laddie” on Flickr and is released under a CC-BY-ND license.