A few posts ago I wrote about building Windows virtual machines with Terraform, and a couple of days ago, “YoureInHell” on Twitter reached out and asked what advice I’d give about having several different terraform modules use the same basic build of custom data.
They’re trying to avoid putting the same template file into several repos (I suspect so that one team can manage the “custom-data”, “user-data” or “cloud-init” files, and another can manage the deployment terraform files), and asked if I had any suggestions.
I had three ideas.
Using a New Module
This was my initial thought; create a new module called something like “Standard Build File”, and this build file contains just the following terraform file, and a template file called “build.tmpl”.
module "buildTemplate" {
  source   = "git::https://git.example.net/buildTemplate.git?ref=latestLive"
  # See https://www.terraform.io/docs/language/modules/sources.html
  #   for more details on how to specify the source of this module
  unsetVar = "Set To This String"
}

output "RenderedTemplate" {
  value = module.buildTemplate.template
}
And that means that you can use the module.buildTemplate.template anywhere you’d normally specify your templateFile, and get a consistent, yet customizable template (and note, because I specified a particular tag, you can use that to move to the “current latest” or “the version we released into live on YYYY-MM-DD” by using a tag, or a commit ref.)
Now, the downside to this is that you’ve now got a whole separate module for creating your instances that needs to be maintained. What are our other options?
Git Submodules for your template
I use Git Submodules a LOT for my code. It’s a bit easy to get into a state with them, particularly if you’re not great at keeping on top of them, but… if you are OK with them, you’d create a repo, again, let’s use “https://git.example.net/buildTemplate.git” as our git repo, and put your template in there. In your terraform git repo, you’d run this command: git submodule add https://git.example.net/buildTemplate.git and this would add a directory to your repo called “buildTemplate” that you can use your templatefile function in Terraform against (like this: templatefile("buildTemplate/build.tmpl", {someVar="var"})).
Now, this means that you’ve effectively got two git repos in one tree, and if any changes occur in your submodule repo, you’d need to do git checkout main ; git pull to get the latest updates from your main branch, and when you check it out initially on another machine, you’ll need to do git clone https://git.example.net/terraform --recurse-submodules to get the submodules populated at the same time.
A benefit to this is that because it’s “inline” with the rest of your tree, if you need to make any changes to this template, it’s clearly where it’s supposed to be in your tree, you just need to remember about the submodule when it comes to making PRs and suchforth.
How about that third idea?
Keep it simple, stupid 😁
Why bother with submodules, or modules from a git repo? Terraform can be quite easy to over complicate… so why not create all your terraform files in something like this structure:
And then in each of your terraform files (web_servers, logic_servers and database_servers) just reference the file in your project root, like this: templatefile("../build.tmpl", {someVar="var"})
The downside to this is that you can’t as easily farm off the control of that build script to another team, and they’d be making (change|pull|merge) requests against the same repo as you… but then again, isn’t that the idea for functional teams? 😃
Yesterday I was struggling a bit with a bash script I was writing. I needed to stop it from running flat out through every loop, and I wanted to see what certain values were at key points in the script.
Yes, I know I could use “read” to pause the script and “echo” to print values, but that leaves a lot of mess that I need to clean up afterwards… so I went looking for something else I could try.
You can have extensive debug statements, which are enabled with a --debug flag or environment variable… but again, messy.
You can run bash -x ./myscript.sh – and, indeed, I do frequently do that… but that shows you the commands which were run at each point, not what the outcome is of each of those commands.
If my problem had been a syntax one, I could have installed shellcheck, which is basically a linter for Bash and other shell scripting languages, but no, I needed more detail about what was happening during the processing.
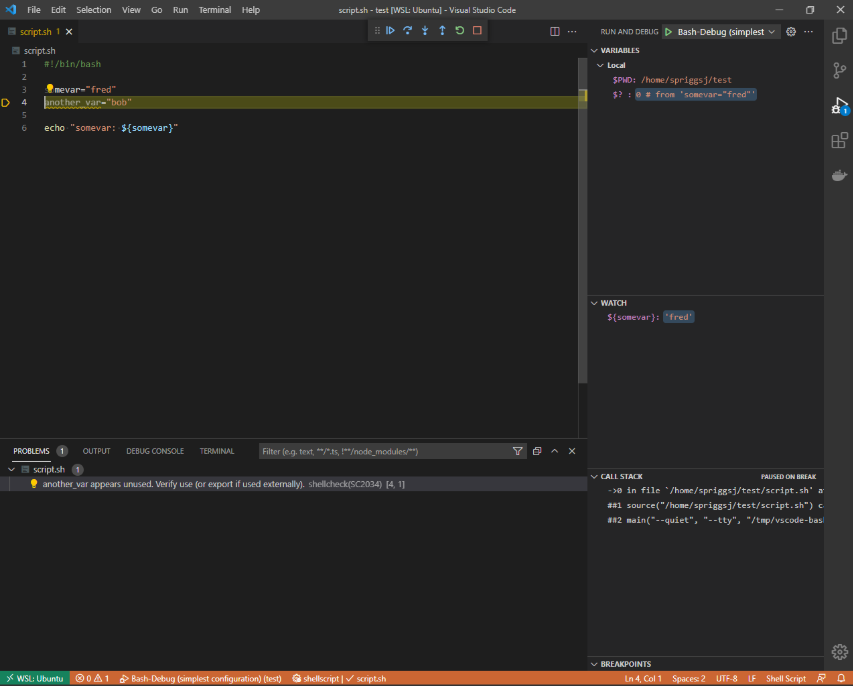
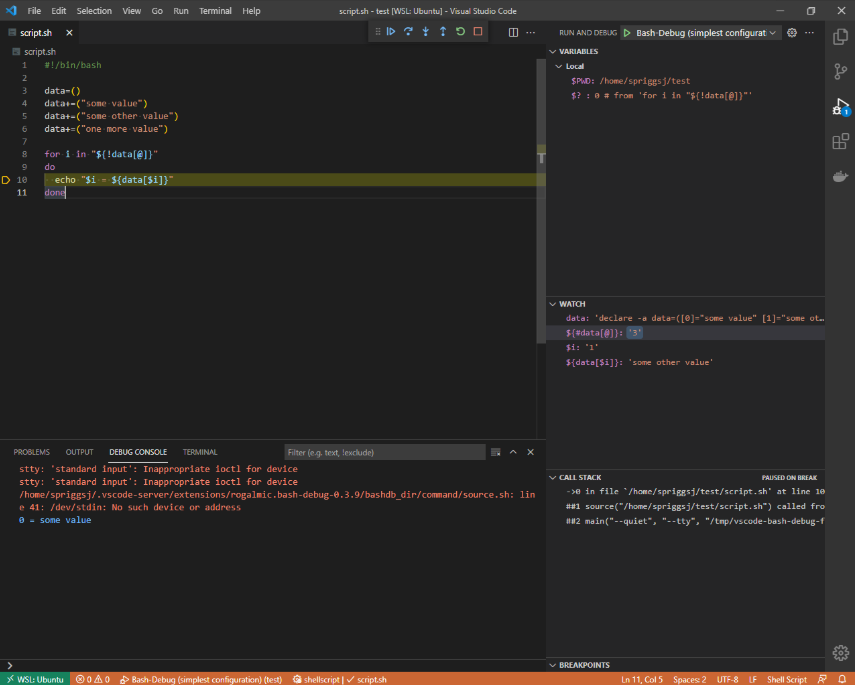
Instead, I wanted something like xdebug (from PHP)… and I found Bash Debug for VSCode. This doesn’t even need you to install any scripts or services on the target machine – it’s interactive, and has a “watch” section, where you either highlight and right-click a variable expression (like $somevar or ${somevar}) to see when it changes. You can see where in the “callstack” you are and see what values are registered by that script.
Shellcheck shows me problems in my code…But Bash Debug helps me to find out what values are at specific points in the code.
On Wednesday, 21st April, I saw a link to a blog post in a chat group for the Linux Lads podcast. This blog post included a discount code to make the GitLab Certified Associate course and exam free. I signed up, and then shared the post to colleagues.
Free GitLab certification course and exam – until 30th April 2021.
GitLab has created a “Certified Associate” certification course which normally costs $650, but is available for free until 30th April using the discount code listed on this blog post and is available for one year after purchase (or free purchase).
I’ve signed up for the course today, and will be taking the 6 hour course, which covers:
Section 1: Self-Study – Introduction to GitLab
* GitLab Overview * GitLab Comparison * GitLab Components and Navigation * Demos and Hands On Exercises
You don’t need your own GitLab environment – you get one provided to you as part of the course.
Another benefit to this course is that you’ll learn about Git as part of the course, so if you’re looking to do any code development, infrastructure as code, documentation as code, or just learning how to store any content in a version control system – this will teach you how 😀
Good luck to everyone participating in the course!
After sharing this post, the GitLab team amended the post to remove the discount code as they were significantly oversubscribed! I’ve heard rumours that it’s possible to find the code, either on Gitlab’s own source code repository, or perhaps using Archive.org’s wayback machine, but I’ve not tried!
On Friday I started the course and completed it yesterday. The rest of this post will be my thoughts on the course itself, and the exam.
Signing up for the course and getting started
Signing up was pretty straightforward. It wasn’t clear that you had a year between when you enrolled for the course and until you first opened the content, but that once you’d opened the link to use the Gitlab demo environment, you had 21 days to use it. You’re encouraged to sign up for the demo environment on the first stage, thereby limiting you to the 21 days from that point. I suspect that if you re-visit that link on a second or third time, you’d get fresh credentials, so no real disaster there, but it does make you feel a bit under pressure to use the environment.
First impressions
The training environment is pretty standard, as far as corporate training goes. You have a side-bar showing the modules you need to complete before the end of the course, and as you scroll down through each module, you get various different media-types arriving, including youtube videos, fade-in text, flashcards which require clicking on and side-scrolling presentation cards. (Honestly, I do wonder whether this is particularly accessible to those with visual or motor impairments… I hope so, but I don’t know how I’d check!)
As you progress through each module, in the sidebar to the left, a circle outline is slowly turned from grey to purple, and when you finish a module the outline is replaced by a filled circle with a white tick in it. At the bottom of each module is a link to the next module.
The content
You have a series of 3 sections:
“Introduction to Gitlab” (aka, “Corporate Propaganda” 😉) which includes the history of the GitLab project and product, how many contributors it has, what it’s primary objective is, and so on. There’s even an “Infotainment” QVC-like advert about how amazing GitLab is in this section, which is quite cute. At the end of this first section, you get a “Hands On” section, where you’re encouraged to use GitLab to create a new Project. I’ll come back to the Hands on sections after this.
“Using Git and Gitlab”, which you’d expect to be more hands-on but is largely more flashcards and presentation cards, each with a hands on section at the end.
“Certification Assessments” has two modules to explain what needs to happen (one before, one after) and then two parts to the “assessment” – a multiple-choice section which has to be answered 100% correctly to proceed, and a “hands on” exam, which is basically a collection of “perform this task” questions, which you are expected to perform in the demo environment.
Hands-on sections focus on a specific task – “create a project”, “commit code”, “create an issue”, “create a merge request” and so-on. There are no tasks which will stretch even the freshest Git user, and seeing the sorts of things that the “Auto DevOps” function can enable might interest someone who wants to use GitLab. I was somewhat disappointed that there was barely any focus on the fact that GitLab can be self-hosted, and what it takes to set something like that up.
We also get to witness the entire power (apparently) of upgrading to the “Premium” and “Ultimate” packages of GitLab’s proprietary add-ons… Epics. I jest of course, I’ve looked and there’s loads more to that upgrade!
The final exams (No Spoilers)
This is in two parts, a multiple-choice selection on a fixed set of 14 questions, with 100% accuracy required to move on to the next stage that can be retaken indefinitely, and a hands-on set of… from memory… 14ish tasks which must be completed on a project you create.
The exam is generally things about GitLab which you’ve covered in the course, but included two questions about using Git that were not covered in any of the modules. For this reason, I’d suggest when you get to those questions, open a git environment, and try each of the commands offered given the specific scenario.
Once you’ve finished the hands-on section, using the credentials you were given, you’re asked to complete a Google Forms page which includes the URL of the GitLab Project you’ve performed your work in, and the username for your GitLab Demo Environment. You submit this form, and in 7 days (apparently, although, given the take-up of the course, I’m not convinced this is an accurate number) you’ll get your result. If you fail, apparently, you’ll be invited to re-try your hands-on exam again.
At least some of the hands-on section tasks are a bit ambiguous, suggesting you should make this change on the first question, and then “merge that change into this branch” (again, from memory) in the next task.
My final thoughts
So, was it worth $650 to take this course? No, absolutely not. I realise that people have put time and effort into the content and there will be people within GitLab Inc checking the results at the end… but at most it’s worth maybe $200, and even that is probably a stretch.
If this course was listed at any price (other than free) would I have taken it? …. Probably not. It’s useful to show you can drive a GitLab environment, but if I were going for a job that needed to use Git, I’d probably point them at a project I’ve created on GitHub or GitLab, as the basics of Git are more likely to be what I’d need to show capabilities in.
Does this course teach you anything new about Git or GitLab that just using the products wouldn’t have done? Tentatively, yes. I didn’t know anything about the “Auto DevOps” feature of GitLab, I’d never used the “Quick Actions” in either issues or merge requests, and there were a couple of git command lines that were new to me… but on the whole, the course is about using a web based version control system, which I’ve been doing for >10 years.
Would this course have taught you anything about Git and GitLab if you were new to both? Yes! But I wouldn’t have considered paying $650… or even $65 for this, when YouTube has this sort of content for free!
What changes would you make to this course? For me, I’d probably introduce more content about the CI/CD elements of GitLab, I might introduce a couple of questions or a module about self-hosting and differences about the tiers (to explain why it would be worth paying $99/user/month for the additional features in the software). I’d probably also split the course up into several pieces, where each of those pieces goes towards a larger target… so perhaps there might be a “basic user” track, which is just “GitLab inc history”, “using git” and “using Gitlab for issues and changes”, then an advanced user, covering “GitLab tiers”, “GitLab CI/CD”, “Auto DevOps”, running “Git Runners”, and perhaps a Self Hosting course which adds running the service yourself, integrating GitLab with other services, and so on. You might also (as GitLab are a very open company) have a “marketing GitLab” course (for TAMs, Pre-Sales and Sales) which could also be consumed externally.
In some work environments, you may find that a “Man In The Middle” (also known as MITM) proxy may have been configured to inspect HTTPS traffic. If you work in a predominantly Windows based environment, you may have had some TLS certificates deployed to your computer when you logged in, or by group policy.
I’ve previously mentioned that if you’re using Firefox on your work machines where you’ve had these certificates pushed to your machine, then you’ll need to enable a configuration flag to make those work under Firefox (“security.enterprise_roots.enabled“), but this is talking about Linux (like Ubuntu, Fedora, CentOS, etc.) and Linux-like environments (like WSL, MSYS2)
Late edit 2021-05-06: Following a conversation with SiDoyle, I added some notes at the end of the post about using the System CA path with the Python Requests library. These notes were initially based on a post by Mohclips from several years ago!
Start with Windows
From your web browser of choice, visit any HTTPS web page that you know will be inspected by your proxy.
If you’re using Mozilla Firefox
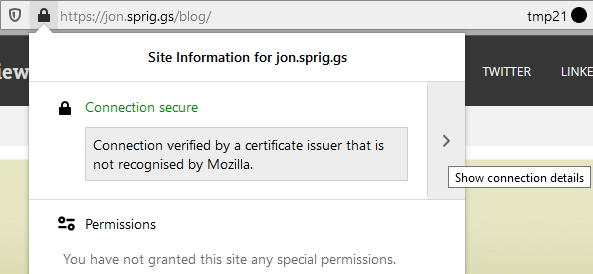
In Firefox, click on this part of the address bar and click on the right arrow next to “Connection secure”:
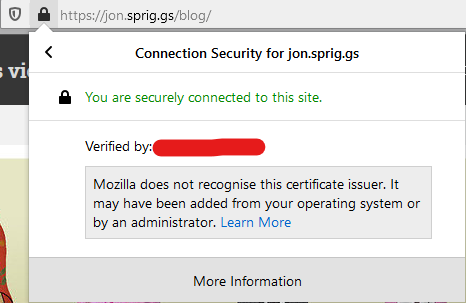
Clicking on the Padlock and then clicking on the Right arrow will take you to the “Connection Security” screen.Certification Root obscured, but this where we prove we have a MITM certificate.
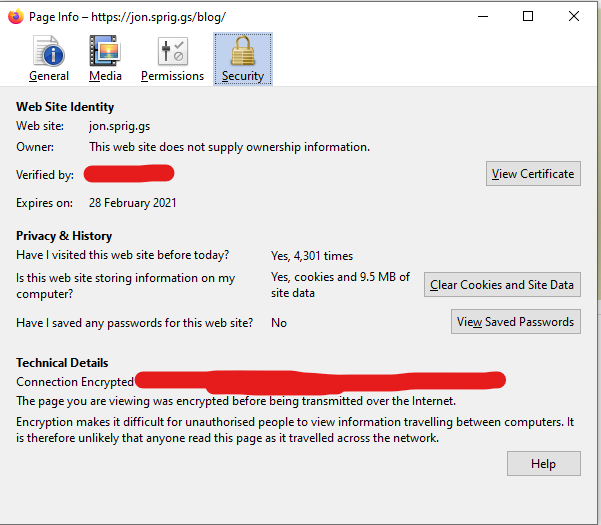
Click on “More Information” to take you to the “Page info” screen
More obscured details, but click on “View Certificate”
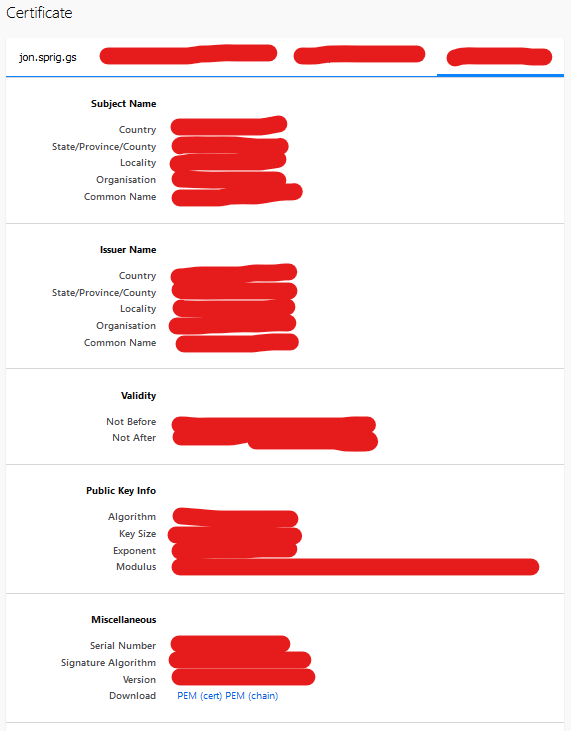
In recent versions of Firefox, clicking on “View Certificate” takes you to a new page which looks like this:
Mammoth amounts of obscuring here! The chain runs from left to right, with the right-most blob being the Root Certificate
Click on the right-most tab of this screen, and navigate down to where it says “Miscellaneous”. Click on the link to download the “PEM (cert)”.
The details on the Certificate Authority (highly obscured!), but here is where we get our “Root” Certificate for this proxy.
Save this certificate somewhere sensible, we’ll need it in a bit!
Note that if you’ve got multiple proxies (perhaps for different network paths, or perhaps for a cloud proxy and an on-premises proxy) you might need to force yourself in into several situations to get these.
If you’re using Google Chrome / Microsoft Edge
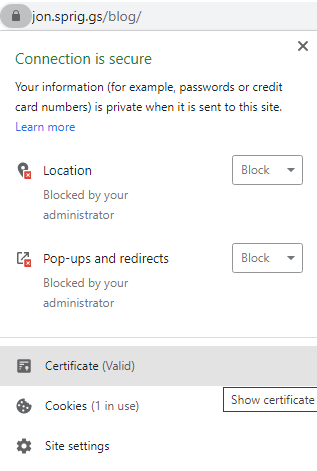
In Chrome or Edge, click on the same area, and select “Certificate”:
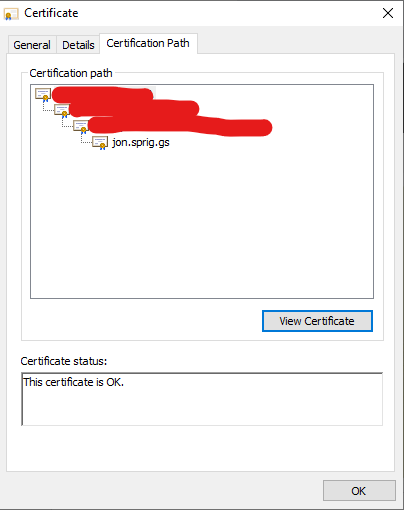
This will take you to a screen listing the “Certification Path”. This is the chain of trust between the “Root” certificate for the proxy to the certificate they issue so I can visit my website:
This screen shows the chain of trust from the top of the chain (the “Root” certificate) to the bottom (the certificate they issued so I could visit this website)
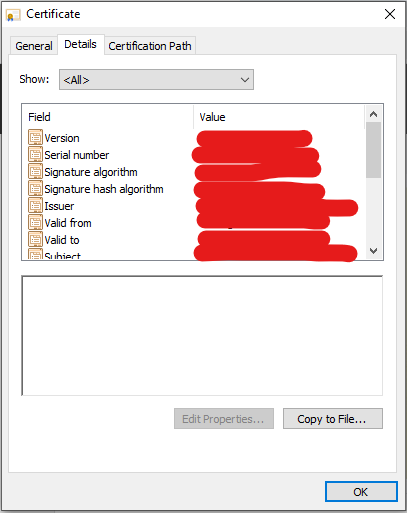
Click on the topmost line of the list, and then click “View Certificate” to see the root certificate. Click on “Details”:
The (obscured) details for the root CA.
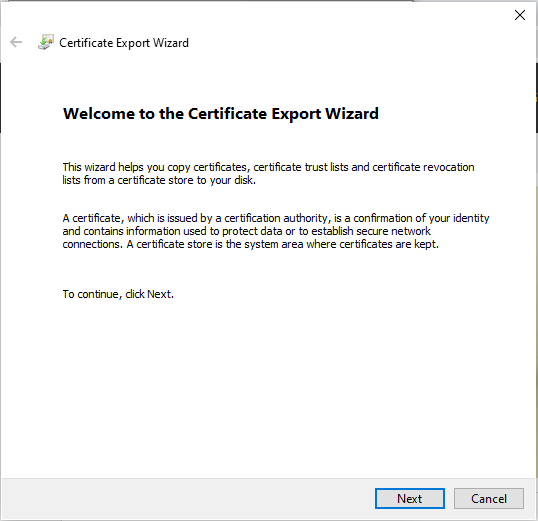
Click on “Copy to File” to open the “Certificate Export Wizard”:
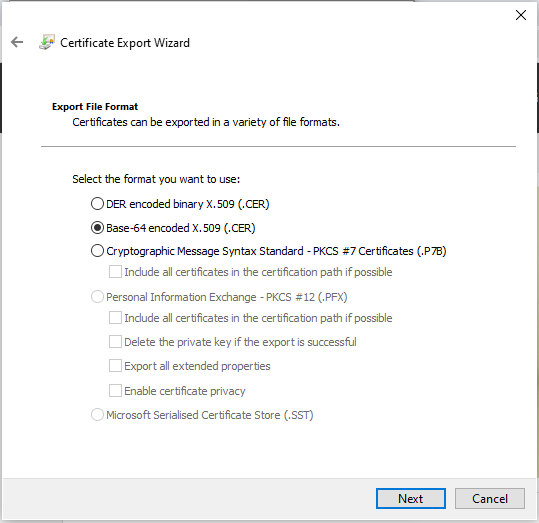
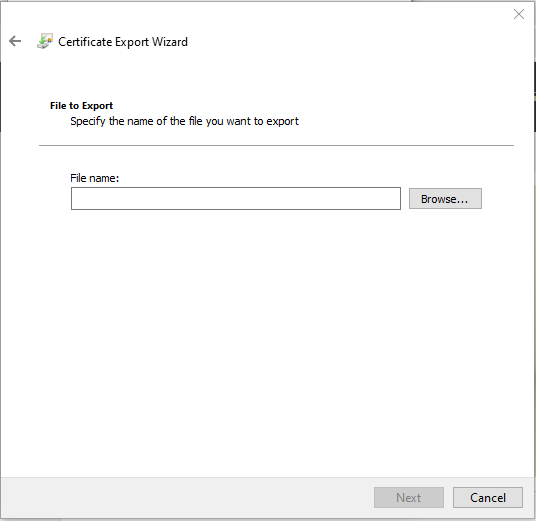
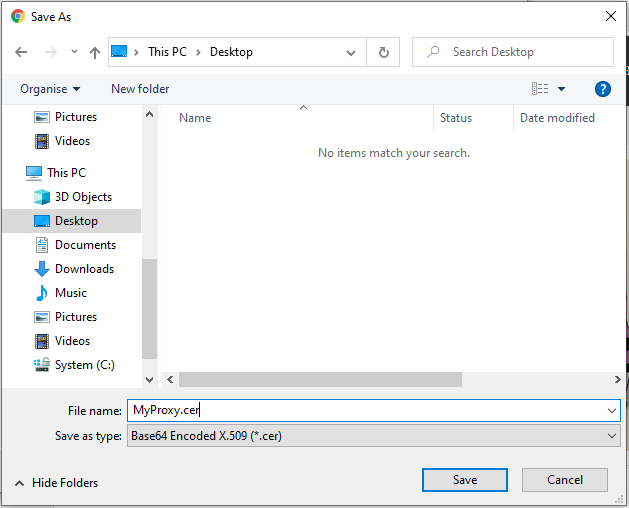
In the Certificate Export Wizard, click “Next”Select “Base-64 encoded X.509 (.CER)” and click “Next”Click on the “Browse…” button to select a path.Name the file something sensible, and put the file somewhere you’ll find it shortly. Click “Save”, then click “Next”.
Once you’ve saved this file, rename it to have the extension .pem. You may need to do this from a command line!
Copy the certificate into the environment and add it to the system keychain
Ubuntu or Debian based systems as an OS, or as a WSL environment
As root, copy the proxy’s root key into /usr/local/share/ca-certificates/<your_proxy_name>.crt (for example, /usr/local/share/ca-certificates/proxy.my.corp.crt) and then run update-ca-certificates to update the system-wide certificate store.
RHEL/CentOS as an OS, or as a WSL environment
As root, copy the proxy’s root key into /etc/pki/ca-trust/source/anchors/<your_proxy_name>.pem (for example, /etc/pki/ca-trust/source/anchors/proxy.my.corp.pem) and then run update-ca-trust to update the system-wide certificate store.
MSYS2 or the Ruby Installer
Open the path to your MSYS2 environment (e.g. C:\Ruby30-x64\msys64) using your file manager (Explorer) and run msys2.exe. Then paste the proxy’s root key into the etc/pki/ca-trust/source/anchors subdirectory, naming it <your_proxy_name>.pem. In the MSYS2 window, run update-ca-trust to update the environment-wide certificate store.
If you’ve obtained the Ruby Installer from https://rubyinstaller.org/ and installed it from there, assuming you accepted the default path of C:\Ruby<VERSION>-x64 (e.g. C:\Ruby30-x64) you need to perform the above step (running update-ca-trust) and then copy the file from C:\Ruby30-x64\mysys64\etc\pki\ca-trust\extracted\pem\tls-ca-bundle.pem to C:\Ruby30-x64\ssl\cert.pem
Using the keychain
Most of your Linux and Linux-Like environments will operate fine with this keychain, but for some reason, Python needs an environment variable to be passed to it for this. As I encounter more environments, I’ll update this post!
The path to the system keychain varies between releases, but under Debian based systems, it is: /etc/ssl/certs/ca-certificates.crt while under RedHat based systems, it is: /etc/pki/tls/certs/ca-bundle.crt.
Python “Requests” library
If you’re getting TLS errors in your Python applications, you need the REQUESTS_CA_BUNDLE environment variable set to the path for the system-wide keychain. You may want to add this line to your /etc/profile to include this path.
I want to use Vagrant-Docker to try standing up some environments. There’s no reasonable justification, it’s just a thing I wanted to do. Normally, I’d go into this long and rambling story about why… but on this occasion, the reason was “Because it’s possible”…
On Windows or Mac there are downloads you can get from the Docker Hub. The Windows Version requires WSL2. I don’t have a Mac, so I don’t know what the requirements are there! Installing WSL2 has a whole host of extra steps that I can’t really do justice to. See this Microsoft article for details.
Installing Vagrant
On Debian and Ubuntu you can add the HashiCorp Apt Repo and then install Vagrant, using these commands:
There are similar instructions for RHEL, CentOS and Fedora users there too.
Windows and Mac users will have to get the application from the download page.
Creating your Dockerfile
A Dockerfile is a simple text file which has a series of line prefixes which instruct the Docker image processor to add certain instructions to the Docker Image. I found two pages which helped me with what to add for this; “Ansible. Docker. Vagrant. Bringing together” and the git repo “AkihiroSuda/containerized-systemd“.
You see, while a Dockerfile is great at starting single binary files or scripts, it’s not very good at running SystemD… and I needed SystemD to be able to run the SSH service that Vagrant requires, and to also run the scripts and commands I needed for the image I wanted to build…
Sooooo…. here’s the Dockerfile I created:
# Based on https://vtorosyan.github.io/ansible-docker-vagrant/
# and https://github.com/AkihiroSuda/containerized-systemd/

FROM debian:buster AS debian_with_systemd

# This stuff enables SystemD on Debian based systems
STOPSIGNAL SIGRTMIN+3
RUN DEBIAN_FRONTEND=noninteractive apt update && DEBIAN_FRONTEND=noninteractive apt install -y --no-install-recommends systemd systemd-sysv dbus dbus-user-session
COPY docker-entrypoint.sh /
RUN chmod 755 /docker-entrypoint.sh
ENTRYPOINT [ "/docker-entrypoint.sh" ]
CMD [ "/bin/bash" ]

# This part installs an SSH Server (required for Vagrant)
RUN DEBIAN_FRONTEND=noninteractive apt install -y sudo openssh-server
RUN mkdir /var/run/sshd
#    We enable SSH here, but don't start it with "now" as the build stage doesn't run anything long-lived.
RUN systemctl enable ssh
EXPOSE 22

# This part creates the vagrant user, sets the password to "vagrant", adds the insecure key and sets up password-less sudo.
RUN useradd -G sudo -m -U -s /bin/bash vagrant
#    chpasswd takes a colon delimited list of username/password pairs.
RUN echo 'vagrant:vagrant' | chpasswd
RUN mkdir -m 700 /home/vagrant/.ssh
# This key from https://github.com/hashicorp/vagrant/tree/main/keys. It will be replaced on first run.
RUN echo 'ssh-rsa AAAAB3NzaC1yc2EAAAABIwAAAQEA6NF8iallvQVp22WDkTkyrtvp9eWW6A8YVr+kz4TjGYe7gHzIw+niNltGEFHzD8+v1I2YJ6oXevct1YeS0o9HZyN1Q9qgCgzUFtdOKLv6IedplqoPkcmF0aYet2PkEDo3MlTBckFXPITAMzF8dJSIFo9D8HfdOV0IAdx4O7PtixWKn5y2hMNG0zQPyUecp4pzC6kivAIhyfHilFR61RGL+GPXQ2MWZWFYbAGjyiYJnAmCP3NOTd0jMZEnDkbUvxhMmBYSdETk1rRgm+R4LOzFUGaHqHDLKLX+FIPKcF96hrucXzcWyLbIbEgE98OHlnVYCzRdK8jlqm8tehUc9c9WhQ== vagrant insecure public key' > /home/vagrant/.ssh/authorized_keys
RUN chmod 600 /home/vagrant/.ssh/authorized_keys
RUN chown -R vagrant:vagrant /home/vagrant
RUN echo 'vagrant ALL=(ALL:ALL) NOPASSWD:ALL' >> /etc/sudoers
This Dockerfile calls out to a separate script, called docker-entrypoint.sh, taken verbatim from AkihiroSuda’s repo, so here’s that file:
#!/bin/bash
set -ex
container=docker
export container

if [ $# -eq 0 ]; then
	echo >&2 'ERROR: No command specified. You probably want to run `journalctl -f`, or maybe `bash`?'
	exit 1
fi

if [ ! -t 0 ]; then
	echo >&2 'ERROR: TTY needs to be enabled (`docker run -t ...`).'
	exit 1
fi

env >/etc/docker-entrypoint-env

cat >/etc/systemd/system/docker-entrypoint.target <<EOF
[Unit]
Description=the target for docker-entrypoint.service
Requires=docker-entrypoint.service systemd-logind.service systemd-user-sessions.service
EOF
cat /etc/systemd/system/docker-entrypoint.target

quoted_args="$(printf " %q" "${@}")"
echo "${quoted_args}" >/etc/docker-entrypoint-cmd
cat /etc/docker-entrypoint-cmd

cat >/etc/systemd/system/docker-entrypoint.service <<EOF
[Unit]
Description=docker-entrypoint.service

[Service]
ExecStart=/bin/bash -exc "source /etc/docker-entrypoint-cmd"
# EXIT_STATUS is either an exit code integer or a signal name string, see systemd.exec(5)
ExecStopPost=/bin/bash -ec "if echo \${EXIT_STATUS} | grep [A-Z] > /dev/null; then echo >&2 \"got signal \${EXIT_STATUS}\"; systemctl exit \$(( 128 + \$( kill -l \${EXIT_STATUS} ) )); else systemctl exit \${EXIT_STATUS}; fi"
StandardInput=tty-force
StandardOutput=inherit
StandardError=inherit
WorkingDirectory=$(pwd)
EnvironmentFile=/etc/docker-entrypoint-env

[Install]
WantedBy=multi-user.target
EOF
cat /etc/systemd/system/docker-entrypoint.service

systemctl mask systemd-firstboot.service systemd-udevd.service
systemctl unmask systemd-logind
systemctl enable docker-entrypoint.service

systemd=
if [ -x /lib/systemd/systemd ]; then
	systemd=/lib/systemd/systemd
elif [ -x /usr/lib/systemd/systemd ]; then
	systemd=/usr/lib/systemd/systemd
elif [ -x /sbin/init ]; then
	systemd=/sbin/init
else
	echo >&2 'ERROR: systemd is not installed'
	exit 1
fi
systemd_args="--show-status=false --unit=multi-user.target"
echo "$0: starting $systemd $systemd_args"
exec $systemd $systemd_args
Now, if you were to run this straight in Docker, it will fail, because you must pass certain flags to Docker to get this to run. These flags are:
-t : pass a “TTY” to the shell
--tmpfs /tmp : Create a temporary filesystem in /tmp
--tmpfs /run : Create another temporary filesystem in /run
--tmpfs /run/lock : Apparently having a tmpfs in /run isn’t enough – you ALSO need one in /run/lock
-v /sys/fs/cgroup:/sys/fs/cgroup:ro : Mount the CGroup kernel configuration values into the container
Blimey, what a long set of text! Perhaps we could hide that behind something a bit more legible? Enter Vagrant.
Creating your Vagrantfile
Vagrant is an abstraction tool, designed to hide complicated virtualisation scripts into a simple command. In this case, we’re hiding a containerisation script into a simple command.
Like with the Dockerfile, I made extensive use of the two pages I mentioned before, as well as the two pages to get the flags to run this.
# Based on https://vtorosyan.github.io/ansible-docker-vagrant/
# and https://github.com/AkihiroSuda/containerized-systemd/
# and https://developers.redhat.com/blog/2016/09/13/running-systemd-in-a-non-privileged-container/
# with tweaks indicated by https://github.com/containers/podman/issues/3295
ENV['VAGRANT_DEFAULT_PROVIDER'] = 'docker'
Vagrant.configure("2") do |config|
  config.vm.provider "docker" do |d|
    d.build_dir       = "."
    d.has_ssh         = true
    d.remains_running = false
    d.create_args     = ['--tmpfs', '/tmp', '--tmpfs', '/run', '--tmpfs', '/run/lock', '-v', '/sys/fs/cgroup:/sys/fs/cgroup:ro', '-t']
  end
end
If you create that file, and run vagrant up you’ll get a working Vagrant boot… But if you try and execute any shell scripts, they’ll fail to run, as the they aren’t passed in with execute permissions… so I want to use Ansible to execute things, as these don’t require execute permissions on the /vagrant directory (also, as the thing I’m building in there requires Ansible… so it’s helpful either way 😁)
Executing Ansible scripts
Ansible still expects to find python in /usr/bin/python but current systems don’t make the symlink to /usr/bin/python3, as python was typically a symlink to /usr/bin/python2… and also I wanted to put the PPA for Ansible in the sources, which is what the Ansible team recommend in their documentation. I’ve done this as part of the Dockerfile, as again, I can’t run scripts from Vagrant. So, here’s the addition I made to the Dockerfile.
FROM debian_with_systemd AS debian_with_systemd_and_ansible
RUN apt install -y gnupg2 lsb-release software-properties-common
RUN apt-key adv --keyserver keyserver.ubuntu.com --recv-keys 93C4A3FD7BB9C367
RUN add-apt-repository "deb http://ppa.launchpad.net/ansible/ansible/ubuntu trusty main"
RUN apt install -y ansible
# Yes, I know. Trusty? On Debian Buster?? But, that's what the Ansible Docs say!
In the Vagrantfile, I’ve added this block:
config.vm.provision "ansible_local" do |ansible|
  ansible.playbook = "test.yml"
end
And I created a test.yml, which looks like this:
---
- hosts: all
  tasks:
  - debug:
      msg: "Hello from Docker"
Running it
So how does this look on Windows when I run it?
PS C:\Dev\VagrantDockerBuster> vagrant up
==> default: Creating and configuring docker networks...
==> default: Building the container from a Dockerfile...
<SNIP A LOAD OF DOCKER STUFF>
    default: #20 DONE 0.1s
    default:
    default: Image: 190ffdeaeed0b7ed206097e6c1d4b5cc796a428700c9bd3e27eedacce47fb63b
==> default: Creating the container...
    default:   Name: 2021-02-13DockerBusterWithSSH_default_1613469604
    default:  Image: 190ffdeaeed0b7ed206097e6c1d4b5cc796a428700c9bd3e27eedacce47fb63b
    default: Volume: C:/Users/SPRIGGSJ/OneDrive - FUJITSU/Documents/95 My Projects/2021-02-13 Docker Buster With SSH:/vagrant
    default:   Port: 127.0.0.1:2222:22
    default:
    default: Container created: b64ed264d8949b12
==> default: Enabling network interfaces...
==> default: Starting container...
==> default: Waiting for machine to boot. This may take a few minutes...
    default: SSH address: 127.0.0.1:2222
    default: SSH username: vagrant
    default: SSH auth method: private key
    default:
    default: Vagrant insecure key detected. Vagrant will automatically replace
    default: this with a newly generated keypair for better security.
    default:
    default: Inserting generated public key within guest...
==> default: Machine booted and ready!
==> default: Running provisioner: ansible_local...
    default: Running ansible-playbook...

PLAY [all] *********************************************************************

TASK [Gathering Facts] *********************************************************
[WARNING]: Platform linux on host default is using the discovered Python
interpreter at /usr/bin/python, but future installation of another Python
interpreter could change this. See https://docs.ansible.com/ansible/2.9/referen
ce_appendices/interpreter_discovery.html for more information.
ok: [default]

TASK [debug] *******************************************************************
ok: [default] => {
    "msg": "Hello from Docker"
}

PLAY RECAP *********************************************************************
default                    : ok=2    changed=0    unreachable=0    failed=0    skipped=0    rescued=0    ignored=0

PS C:\Dev\VagrantDockerBuster>
And on Linux?
Bringing machine 'default' up with 'docker' provider...
==> default: Creating and configuring docker networks...
==> default: Building the container from a Dockerfile...
<SNIP A LOAD OF DOCKER STUFF>
    default: Removing intermediate container e56bed4f7be9
    default:  ---> cef749c205bf
    default: Successfully built cef749c205bf
    default:
    default: Image: cef749c205bf
==> default: Creating the container...
    default:   Name: 2021-02-13DockerBusterWithSSH_default_1613470091
    default:  Image: cef749c205bf
    default: Volume: /home/spriggsj/Projects/2021-02-13 Docker Buster With SSH:/vagrant
    default:   Port: 127.0.0.1:2222:22
    default:
    default: Container created: 3fe46b02d7ad10ab
==> default: Enabling network interfaces...
==> default: Starting container...
==> default: Waiting for machine to boot. This may take a few minutes...
    default: SSH address: 127.0.0.1:2222
    default: SSH username: vagrant
    default: SSH auth method: private key
    default:
    default: Vagrant insecure key detected. Vagrant will automatically replace
    default: this with a newly generated keypair for better security.
    default:
    default: Inserting generated public key within guest...
    default: Removing insecure key from the guest if it's present...
    default: Key inserted! Disconnecting and reconnecting using new SSH key...
==> default: Machine booted and ready!
==> default: Running provisioner: ansible_local...
    default: Running ansible-playbook...

PLAY [all] *********************************************************************

TASK [Gathering Facts] *********************************************************
[WARNING]: Platform linux on host default is using the discovered Python
interpreter at /usr/bin/python, but future installation of another Python
interpreter could change this. See https://docs.ansible.com/ansible/2.9/referen
ce_appendices/interpreter_discovery.html for more information.
ok: [default]

TASK [debug] *******************************************************************
ok: [default] => {
    "msg": "Hello from Docker"
}

PLAY RECAP *********************************************************************
default                    : ok=2    changed=0    unreachable=0    failed=0    skipped=0    rescued=0    ignored=0
So, if you’re crazy and want to do Vagrant using Docker with Debian Buster and Ansible, this is how to do it. I don’t know how much I’m likely to be using this in the future, but if you use it, let me know what you’re doing with it! 😀
Featured image is “Family” by “Ivan” on Flickr and is released under a CC-BY license.
Over the last week, I discovered a new tool for my arsenal called Architectural Decision Records (ADR). They were first written about in 2011, in a post called “Documenting Architecture Decisions“, where the author, Michael Nygard, advocates for short documents explaining each decision that influences the architecture of an environment.
I found this via a Github repository, created by the team at gov.uk, which includes their ADR library, and references the tool they use to manage these documents – adr-tools.
Late edit 2021-12-14: I released (v0.0.1) my own rust-based application for making Decision Records. Yes, Decision Records – not Architecture Decision Records… because I think you should be able to apply the same logic to all decisions, not just architectural ones.
Installing adr-tools on Linux
Currently adr-tools are easier to install under OSX rather than Linux or Windows Subsystem for Linux (WSL) (I’m working on this – bear with me! 😃 ).
The current installation notes suggest for Linux (which would also work on WSL) is to download the latest release tar.gz or zip file and unpack it into your path somewhere. This isn’t exactly the best way to deploy anything on Linux, but… I guess it works right now?
For me, I downloaded the file, and unpacked the whole tar.gz file (as root) into /usr/local/bin/, giving me a directory of /usr/local/bin/adr-tools-3.0.0/. There’s a subdirectory in here, called src which contains a large number of files – mostly starting _adr or adr- and two additional files, init.md and template.md.
Rather than putting all of these files into /usr/local/bin directly, instead I leave them in the adr-tools-3.0.0 directory, and create a symbolic link (symlink) to the /usr/local/bin directory with this command:
cd /usr/local/bin
ln -s adr-tools-3.0.0/src/* .
This gives me all those files in one place, so I can refer to them later.
An aside – why link everything in that src directory? (Feel free to skip this block!)
Now, why, you might ask, do all of these unrelated files need to be in the same place? Well…. the author of the script has put this in at the top of almost all the files:
#!/bin/bash
set -e
eval "$($(dirname $0)/adr-config)"
There are, technically, good reasons for this! This is designed to be run in, what in the Windows world, you might call as a “Portable Script”. So, you bung adr-tools into some directory somewhere, and then just call adr somecommand and it knows that all the files are where they need to be. The (somewhat) down side to this is that if you just want to call adr somecommand rather than path/to/my/adr somecommand then all those files need to be there
I’m currently looking to see if I can improve this somewhat, so that it’s not quite so complex to install, but for now, that’s what you need.
Anyway…
Using adr-tools to document your decisions
I’ll start documenting a fictional hosted web service project, and note down some of the decisions which have been made.
Initializing your ADR directory
Start by running adr init. You may want to specify a directory where you want to put these records, so instead use: adr init path/to/adr, like this:
Initializing the ADR in “documentation/architecture-decisions” with adr init documentation/architecture-decisions
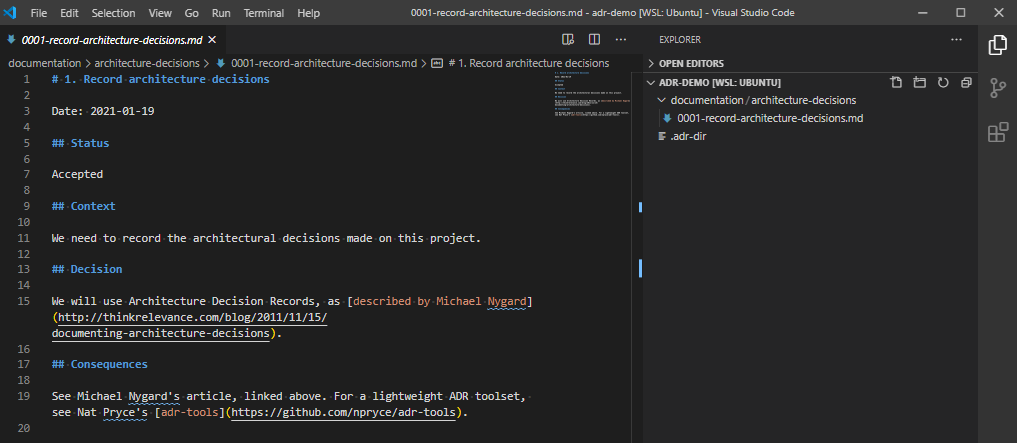
You’ll notice that when I run this command, it creates a new entry, called 0001-record-architecture-decisions.md. Let’s open this up, and see what’s in here.
The VSCode record for the choice to use ADR. It is a markdown file, with the standard types of data recorded.
In here we have the record ID (1.), the title of the record Record architecture decisions, the date the choice was made Date: 2021-01-19, a status of Accepted, the context on why we made this choice, the decision, and the consequences of making this decision. Make changes, if needed, and save it. Let’s move on.
Creating our first own record
This all is quite straightforward thus far. Let’s create our next record.
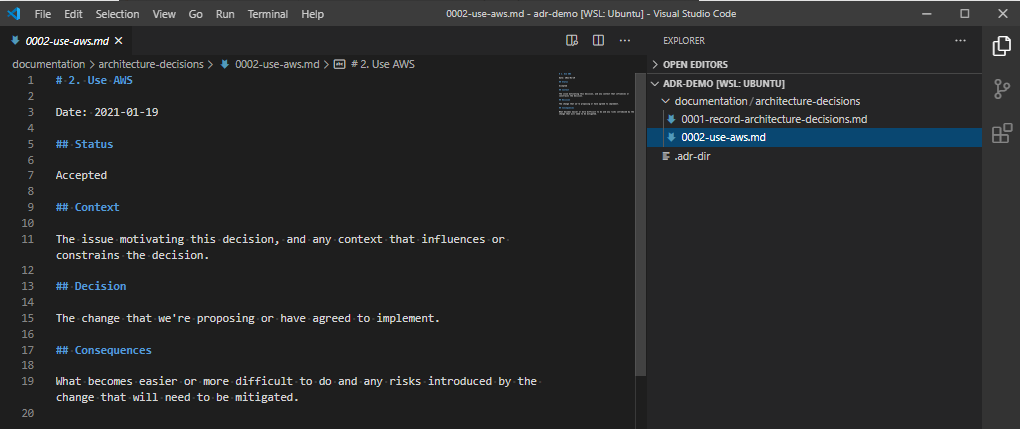
Issuing the command adr new <sometitle> you create the next ADR record.
Let’s open up that record.
The template for the ADR record for “Use AWS”.
Like the first record, we have a title, a status, a context, decision and consequences. Let’s define these.
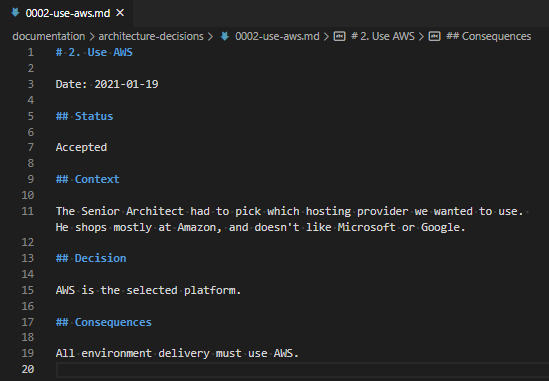
A “finished” brief ADR record.
This document shouldn’t be very long! It just describes why a choice was made and what that entails.
Changing decisions – completely replacing (superseding) a decision
Of course, over time, decisions will be replaced due to various decisions elsewhere.
You can ask adr to supersede a previous record, using the “-s” flag, and the record number.
Let’s look at how that works on the second ADR record.
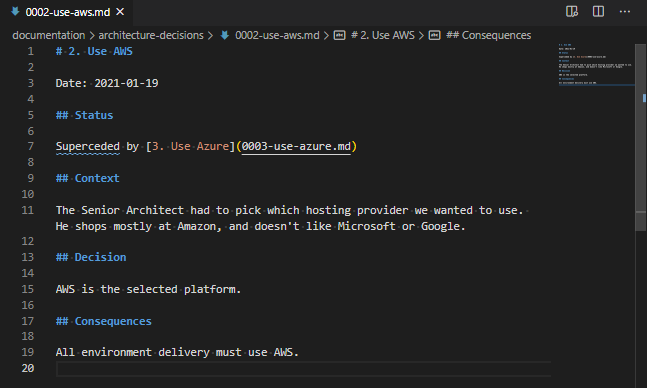
After the command adr new -s 2 Use Azure, the ADR record number 2 has a new status, “Superceded by” and the superseded linked document. Yes, “Superceded” is a typo. There is an open PR for it
So, under the “Status”, where is previously said “Approved”, it now says “Superceded by [3. Use Azure](0003-use-azure.md)“. This is a markdown statement which indicates where the superseded document is located. As I mentioned in the comment below the above image, there is an open Pull Request to fix this on the adr-tools, so hopefully that typo won’t last long!
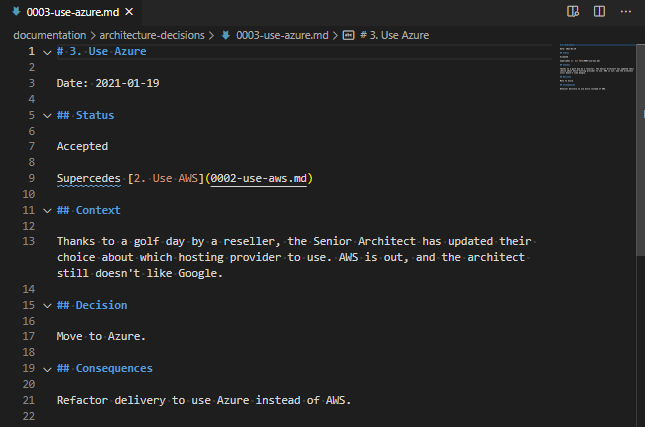
We’ve got our new ADR too – let’s take a look at that one?
Our new ADR shows that it “supercedes” the previous record. Which is good! Typo aside :)
Other references
Of course, you don’t always completely overrule a decision. Sometimes your decision is influenced by, or has a dependency on something else, like this one.
We know which provider we’re using at long last, now let’s pick a region. Use the -l flag to “link” between the referenced and new ADR. The context for the -l flag is “<number>:<text for link to number>:<text for link in targetted document>”.
The command here is:
adr new -l '3:Dependency:Influences' Use Region UK South and UK West
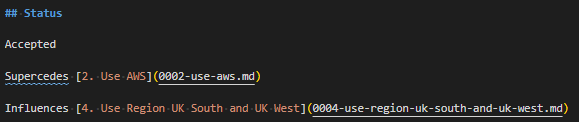
I’m just going to crop from the “Status” block on both the referenced ADR (3) and the ADR which references it (4):
Status block in ADR 0003 which is referenced by ADR 0004Status block in the new ADR 0004 which references ADR 0003
And of course, you can also use the same switch to mark documents as partially obsoleted, like this:
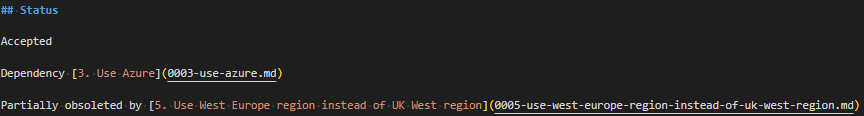
adr new -l '4:Partially obsoletes:Partially obsoleted by' Use West Europe region instead of UK West region
Status block in ADR 0004 indicating it’s partially obsoleted. Probably worth updating the status properly to show it’s not just “Accepted”.
If you forget to add the referencing in, you can also use the adr link command, like this:
adr link 3 Influences 5 Dependency
To be clear, that command adds a (complete) line to ADR 0003 saying “Influences [5. ADR Title](link)” and a separate (complete) line to ADR 0005 saying “Dependency [3. ADR Title](link)“.
What else can we do?
There are four other “things” that it’s worth doing at this point.
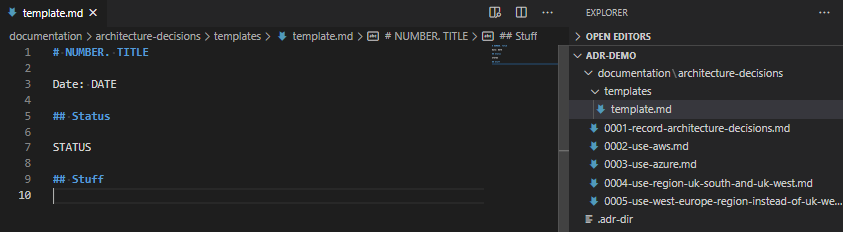
Note that you can change the template per-ADR directory.
Create a directory called “templates” in the ADR directory, and put a file in there called “template.md“. Tweak this as you need. Ensure you have AT LEAST the line ## Status and # NUMBER. TITLE as these are required by the script.
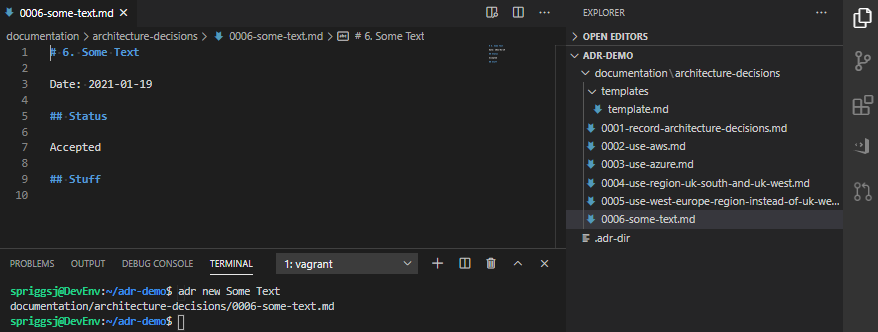
A much abbreviated template file, containing just “Number”, “Title”, “Date”, “Status”, and a new dummy heading called “Stuff”.And the result of running adr new Some Text once you’ve created that template.
As you can see, it’s possible to add all sorts of content in this template as a result. Bear in mind, before your template turns into something like this, that it’s supposed to be a short document explaining why each decision was made, not a funding proposal, or a complex epic of your user stories!
Be careful not to let your template run away with you!
Note that you can automatically open an editor, by setting the EDITOR (where the process is expected to finish before returning control, like using nano, emacs or vim, for example) or VISUAL (where the process is expected to “fork”, like for example, gedit or vscode) environment variable, and then running adr new A Title, like this:
We can create “Table of Contents” files, using the adr generate toc command, like this:
Generating the table of contents, for injecting into other files.
This can be included into your various other markdown files. There are switches, so you can set the link path, but your best bet is to find that using adr help generate toc.
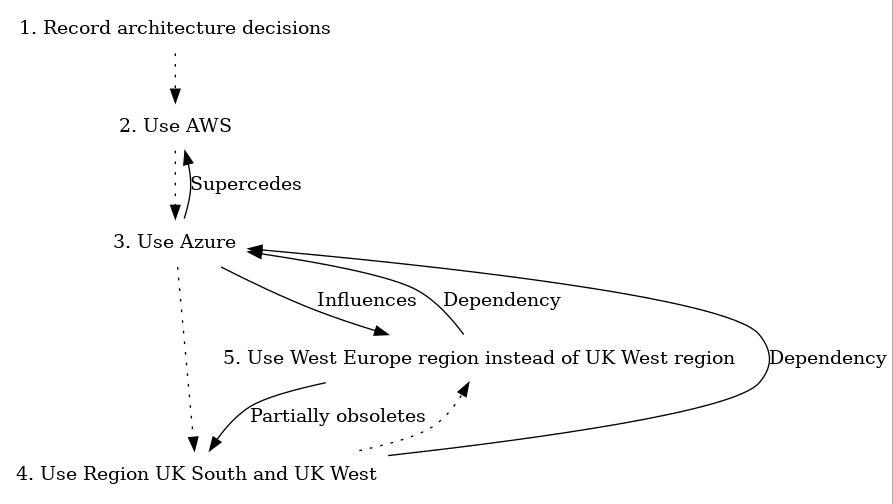
We can also generate graphviz files of the link maps between elements of the various ADRs, like this: adr generate graph | dot -Tjpg > graph.jpg
If you omit the “| dot -Tjpg > graph.jpg” part, then you’ll see the graphviz output, which looks like this: (I’ve removed the documents 6 and 7).
digraph {
  node [shape=plaintext];
  subgraph {
    _1 [label="1. Record architecture decisions"; URL="0001-record-architecture-decisions.html"];
    _2 [label="2. Use AWS"; URL="0002-use-aws.html"];
    _1 -> _2 [style="dotted", weight=1];
    _3 [label="3. Use Azure"; URL="0003-use-azure.html"];
    _2 -> _3 [style="dotted", weight=1];
    _4 [label="4. Use Region UK South and UK West"; URL="0004-use-region-uk-south-and-uk-west.html"];
    _3 -> _4 [style="dotted", weight=1];
    _5 [label="5. Use West Europe region instead of UK West region"; URL="0005-use-west-europe-region-instead-of-uk-west-region.html"];
    _4 -> _5 [style="dotted", weight=1];
  }
  _3 -> _2 [label="Supercedes", weight=0]
  _3 -> _5 [label="Influences", weight=0]
  _4 -> _3 [label="Dependency", weight=0]
  _5 -> _4 [label="Partially obsoletes", weight=0]
  _5 -> _3 [label="Dependency", weight=0]
}
To make the graphviz part work, you’ll need to install graphviz, which is just an apt get away.
Any caveats?
adr-tools is not actively maintained. I’ve contacted the author, about seeing if I can help out with the maintenance, but… we’ll see, and given some fairly high profile malware takeovers of projects like this sort of thing on Github, Docker, NPM, and more… I can see why there might be some reluctance to consider it! Also, I’m an unknown entity, I’ve just dropped in on the project and offered to help, with no previous exposure to the lead dev or the project… so, we’ll see. Worst case, I’ll fork it!
Working with this also requires an understanding of markdown files, and why these might be a useful document format for records like this. There was a PR submitted to support multiple file formats (like asciidoc and rst) but these were not approved by the author.
There is no current intention to support languages other than English. The tool is hard-coded to look for strings like “status” and “superceded” which is hard. Part of the reason I raised the PRs I did was to let me fix some of these sorts of issues. Again, we’ll see what happens.
Lastly, it can be overwhelming to see a lot of documents in one place, particularly if they’re as granular as the documents I produced in this demo. If the project supported categories, or could be broken down into components (like doc/adr/networking and doc/adr/server_builds and doc/adr/applications) then this might help, but it’s not on the roadmap right now!
Late edit 2021-01-25: If you don’t think these templates have enough context or content, there are lots of others listed on Joel Parker Henderson’s repo of examples and templates. If you want a python based viewer of ADR records, take a look at adr-viewer.
You see, the key part of that post wasn’t that they were posting to Home Assistant when they were logging in, but instead that they were triggering a webhook on login. And I can do stuff with Webhooks.
What’s a webhook?
A webhook is a callable URL, either with a “secret” embedded in the URL or some authentication header that lets you trigger an action of some sort. I first came across these with Github, but they’re pretty common now. Services will offer these as a way to get an action in one service to do something in another. A fairly common webhook for those getting started with these sorts of things is where creating a pull request (PR) on a Github repository will trigger a message on something like Slack to say the PR is there.
Well, that’s all well and good, but what does Matrix or Huginn have to do with things?
Matrix is a decentralized, end to end encrypted, eventually consistent database system, that just happens to be used extensively as a chat network. In particular, it’s used by Open Source projects, like KDE and Mozilla, and by Government bodies, like the whole French goverment (lead by DINSIC) the German Bundeswehr (Unified Armed Forces) department.
Huginn is a system for building agents that perform automated tasks for you online. They can read the web, watch for events, and take actions on your behalf. Huginn’s Agents create and consume events, propagating them along a directed graph. Think of it as a hackable version of IFTTT or Zapier on your own server. You always know who has your data. You do.
With Huginn, I can create “agents”, including a “receive webhook agent” that will take the content I send, and tweak it to do something else. In the past I used IFTTT to do some fun things, like making this blog work, but now I use Huginn to post Tweets when I post to this blog.
So that I knew that Huginn was posting my twitter posts, I created a Matrix room called “Huginn Alerts” and used the Matrix account I created for the video I mentioned before to send me messages that it had made the posts I wanted. I followed the guidance from this page to do it: https://drwho.virtadpt.net/archive/2020-02-12/integrating-huginn-with-a-matrix-server/
Enough already. Just show me what you did.
In Element.io
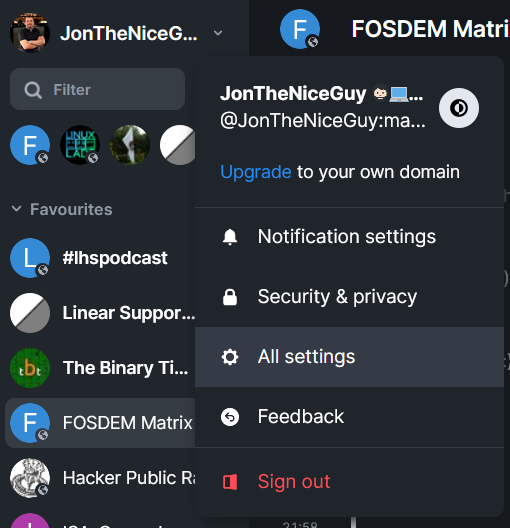
Get an access token for the Matrix account you want to post with.
Click where it says your handle, then click on where it says “All Settings”.
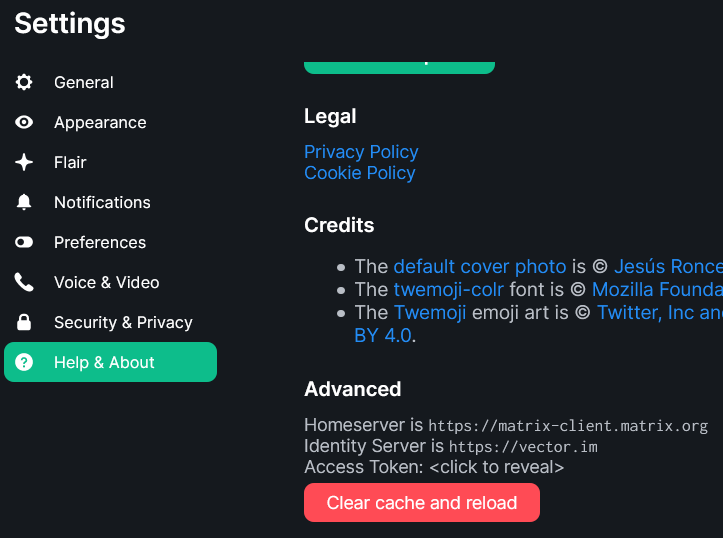
Then click on “Help & About” and scroll to the bottom of that page, where it says “Advanced”
Get to the “Advanced” part of the settings, under “Help & About” to get your access token.
Click where it says “Access Token: <click to reveal>” (strangely, I’m not posting that 😉)
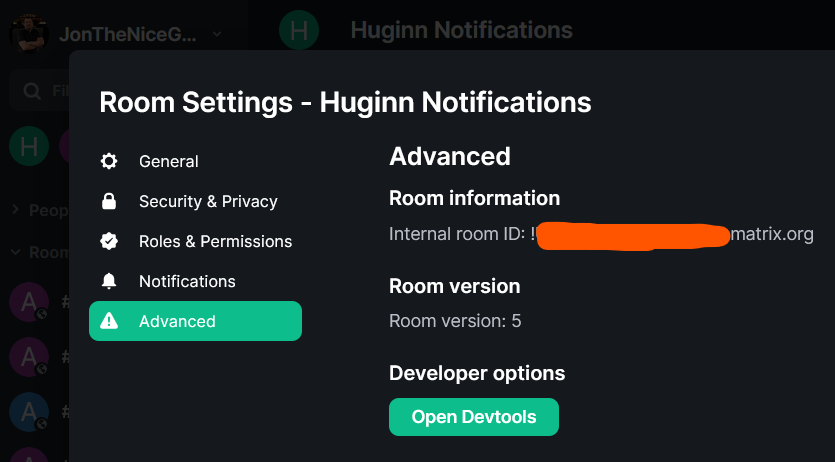
Click on the room, then click on it’s name at the top to open the settings, then click on “Advanced” to get the “Internal room ID”
Gettng the Room ID. Note, it starts with an exclamation mark (!) and ends :<servername>.
In Huginn
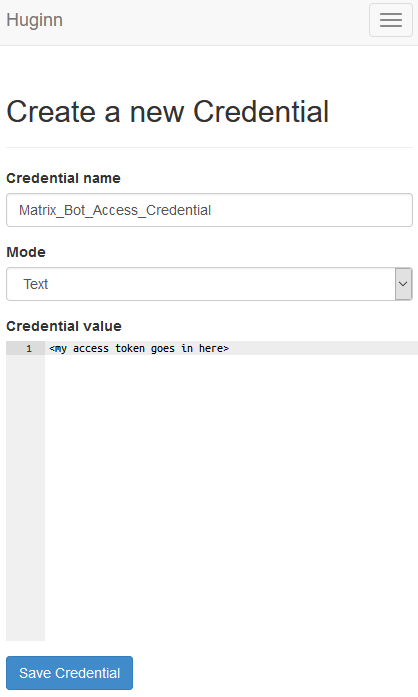
Go to the “Credentials” tab, and click on “New Credential”. Give the credential a name (perhaps “Matrix Bot Access Token”), leave it as text and put your access token in here.
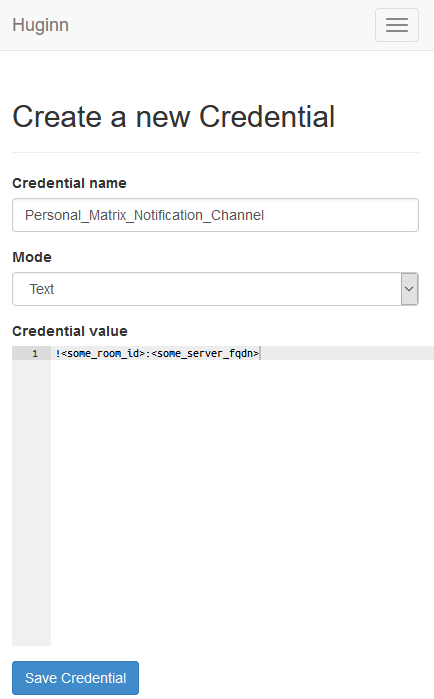
Create a Credential for the Room ID. Like before, name it something sensible and put the ID you found earlier.
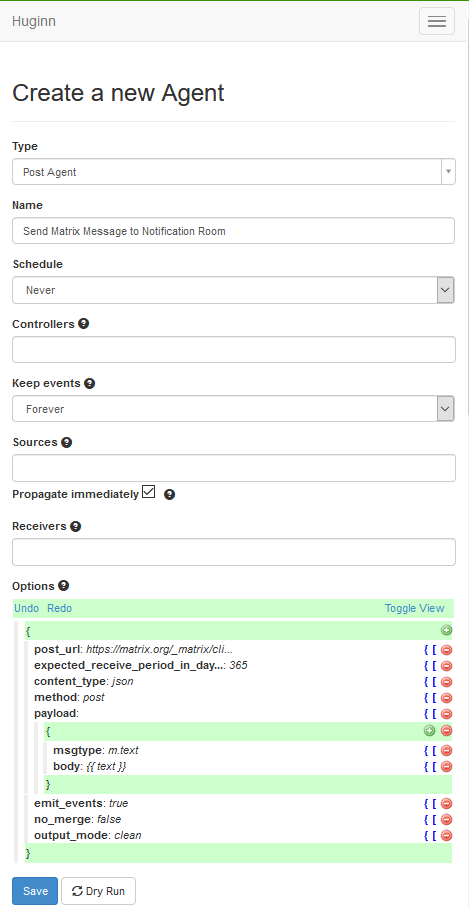
Create a “Post Agent” by going to Agents and selecting “New agent”. This will show just the “Type” box. You can type in this box to put “Post Agent” and then find it. That will then provide you with the rest of these boxes. Provide a name, and tick the box marked “Propagate immediately”. I’ll cover the content of the “Options” box after this screenshot.
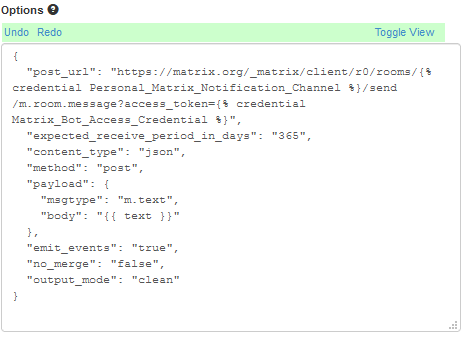
In the “Options” block is a button marked “Toggle View”. Select this which turns it from the above JSON pretty editor, into this text field (note your text is likely to be different):
Note that the “post_url” value contains two “credential” values, like this:
{% credential Personal_Matrix_Notification_Channel %} (this is the Room ID we found earlier) and {% credential Matrix_Bot_Access_Credential %} (this is the Access Token we found earlier).
If you’ve used different names for these values (which are perfectly valid!) then just change these two. The part where it says “{{ text }}” leave there, because we’ll be using that in a later section. Click “Save” (the blue button at the bottom).
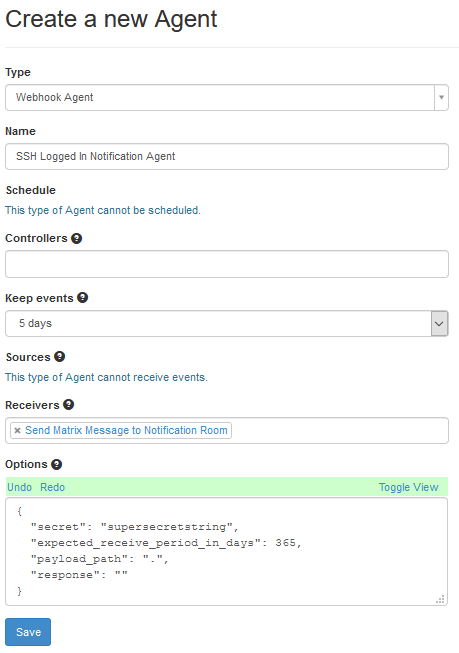
Create a Webhook Agent. Go to Agents and then “New Agent”. Select “Webhook Agent” from the “Type” field. Give it a name, like “SSH Logged In Notification Agent”. Set “Keep Events” to a reasonable number of days, like 5. In “Receivers” find the Notification agent you created (“Send Matrix Message to Notification Room” was the name I used). Then, in the screenshot, I’ve pressed the “Toggle View” button on the “Options” section, as this is, to me a little clearer.
Change the “secret” from “supersecretstring” to something a bit more useful and secure.
The “Expected Receive Period in Days” basically means, if you’ve not had an event cross this item in X number of days, does Huginn think this agent is broken? And the payload path of “.” basically means “pass everything to the next agent”.
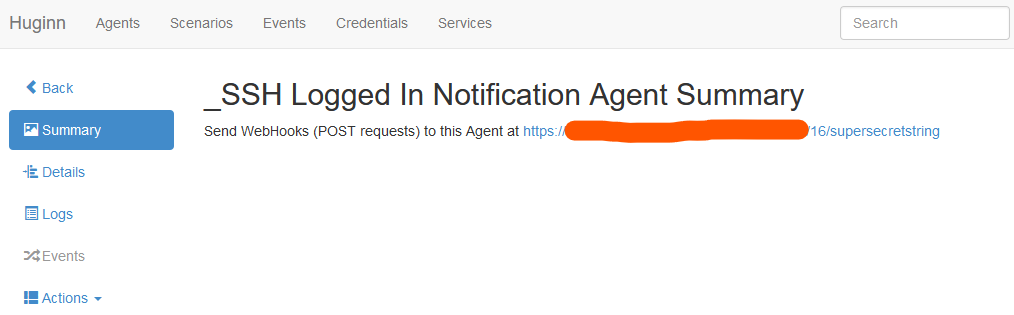
Once you’ve completed this step, press “Save” which will take you back to your agents, and then go into the agent again. This will show you a page like this:
Copy that URL, because you’ll need it later…
On the server you are logging the SSH to
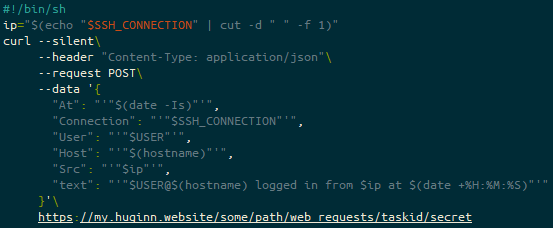
As root, create a file called /etc/ssh/sshrc. This file will be your script that will run every time someone logs in. It must have the file permissions 0644 (u+rw,g+r,o+r), which means that there is a slight risk that the Webhook secret is exposed.
The heading line (#!/bin/sh) is more there for shellcheck, as, according to the SSH man page this is executed by /bin/sh either way.
The bulk of these values (At, Connection, User, Host or Src) are not actually used by Huginn, but might be useful for later… the key one is text, which if you recall from the “Send Matrix Message to Notification Room” Huginn agent, we put {{ text }} into the “options” block – that’s this block here!
So what happens when we log in over SSH?
SSH asks the shell in the user’s context to execute /etc/ssh/sshrc before it hands over to the user’s login session. This script calls curl and hands some POST data to the url.
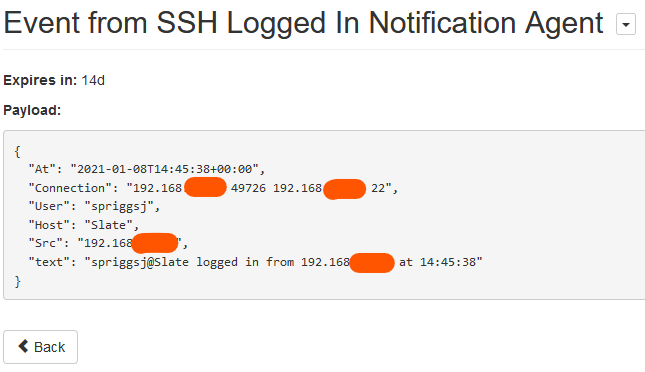
Huginn receives this POST via the “SSH Logged In Notification Agent”, and files it.
Huginn then hands that off to the “Send Matrix Message to Notification Room”:
Huginn makes a POST to the Matrix.org server, and Matrix sends the finished message to all the attached clients.
Featured image is “Raven” by “Jim Bahn” on Flickr and is released under a CC-BY license.
I tend to write long and overly complicated set_fact statements in Ansible, ALL THE DAMN TIME. I write stuff like this:
rulebase: |
  {
    {% for var in vars | dict2items %}
      {% if var.key | regex_search(regex_rulebase_match) | type_debug != "NoneType"
        and (
          var.value | type_debug == "dict"
          or var.value | type_debug == "AnsibleMapping"
        ) %}
        {% for item in var.value | dict2items %}
          {% if item.key | regex_search(regex_rulebase_match) | type_debug != "NoneType"
            and (
              item.value | type_debug == "dict"
              or item.value | type_debug == "AnsibleMapping"
            ) %}
            "{{ var.key | regex_replace(regex_rulebase_match, '\2') }}{{ item.key | regex_replace(regex_rulebase_match, '\2') }}": {
              {# This block is used for rulegroup level options #}
              {% for key in ['log_from_start', 'log', 'status', 'nat', 'natpool', 'schedule', 'ips_enable', 'ssl_ssh_profile', 'ips_sensor'] %}
                {% if var.value[key] is defined and rule.value[key] is not defined %}
                  {% if var.value[key] | type_debug in ['string', 'AnsibleUnicode'] %}
                    "{{ key }}": "{{ var.value[key] }}",
                  {% else %}
                    "{{ key }}": {{ var.value[key] }},
                  {% endif %}
                {% endif %}
              {% endfor %}
              {% for rule in item.value | dict2items %}
                {% if rule.key in ['sources', 'destinations', 'services', 'src_internet_service', 'dst_internet_service'] and rule.value | type_debug not in ['list', 'AnsibleSequence'] %}
                  "{{ rule.key }}": ["{{ rule.value }}"],
                {% elif rule.value | type_debug in ['string', 'AnsibleUnicode'] %}
                  "{{ rule.key }}": "{{ rule.value }}",
                {% else %}
                  "{{ rule.key }}": {{ rule.value }},
                {% endif %}
              {% endfor %}
            },
          {% endif %}
        {% endfor %}
      {% endif %}
    {% endfor %}
  }
Now, if you’re writing set_fact or vars like this a lot, what you tend to end up with is the dreaded dict2items requires a dictionary, got instead. which basically means “Hah! You wrote a giant blob of what you thought was JSON, but didn’t render right, so we cast it to a string for you!”
The way I usually write my playbooks, I’ll do something with this set_fact at line, let’s say, 10, and then use it at line, let’s say, 500… So, I don’t know what the bloomin’ thing looks like then!
- name: Type Check - is_a_string
  assert:
    quiet: yes
    that:
    - vars[this_key] is not boolean
    - vars[this_key] is not number
    - vars[this_key] | int | string != vars[this_key] | string
    - vars[this_key] | float | string != vars[this_key] | string
    - vars[this_key] is string
    - vars[this_key] is not mapping
    - vars[this_key] is iterable
    success_msg: "{{ this_key }} is a string"
    fail_msg: |-
      {{ this_key }} should be a string, and is instead
      {%- if vars[this_key] is not defined %} undefined
      {%- else %} {{ vars[this_key] is boolean | ternary(
        'a boolean',
        (vars[this_key] | int | string == vars[this_key] | string) | ternary(
          'an integer',
          (vars[this_key] | float | string == vars[this_key] | string) | ternary(
            'a float',
            vars[this_key] is string | ternary(
              'a string',
              vars[this_key] is mapping | ternary(
                'a dict',
                vars[this_key] is iterable | ternary(
                  'a list',
                  'unknown (' ~ vars[this_key] | type_debug ~ ')'
                )
              )
            )
          )
        )
      )}}{% endif %} - {{ vars[this_key] | default('unset') }}
I hope this helps you, bold traveller with complex jinja2 templating requirements!
(Oh, and if you get “template error while templating string: no test named 'boolean'“, you’re probably running Ansible which you installed using apt from Ubuntu Universe, version 2.9.6+dfsg-1 [or, at least I was!] – to fix this, use pip to install a more recent version – preferably using virtualenv first!)
My current Ansible project relies on me collecting a lot of data from AWS and then checking it again later, to see if something has changed.
This is great for one-off tests (e.g. terraform destroy ; terraform apply ; ansible-playbook run.yml) but isn’t great for repetitive tests, especially if you have to collect data that may take many minutes to run all the actions, or if you have slow or unreliable internet in your development environment.
To get around this, I wrote a wrapper for caching this data.
At the top of my playbook, run.yml, I have these tasks:
- name: Set Online Status.
  # This stores the value of run_online, unless run_online
  # is not set, in which case, it defines it as "true".
  ansible.builtin.set_fact:
    run_online: |-
      {{- run_online | default(true) | bool -}}

- name: Create cache_data path.
  # This creates a "cached_data" directory in the same
  # path as the playbook.
  when: run_online | bool and cache_data | default(false) | bool
  delegate_to: localhost
  run_once: true
  file:
    path: "cached_data"
    state: directory
    mode: 0755

- name: Create cache_data for host.
  # This creates a directory under "cached_data" in the same
  # path as the playbook, with the name of each of the inventory
  # items.
  when: run_online | bool and cache_data | default(false) | bool
  delegate_to: localhost
  file:
    path: "cached_data/{{ inventory_hostname }}"
    state: directory
    mode: 0755
Running this sets up an expectation for the normal operation of the playbook, that it will be “online”, by default.
Then, every time I need to call something “online”, for example, collect EC2 Instance Data (using the community.aws.ec2_instance_info module), I call out to (something like) this set of tasks, instead of just calling the task by itself.
- name: List all EC2 instances in the regions of interest.
  when: run_online | bool
  community.aws.ec2_instance_info:
    region: "{{ item.region_name }}"
  loop: "{{ regions }}"
  loop_control:
    label: "{{ item.region_name }}"
  register: regional_ec2

- name: "NOTE: Set regional_ec2 data path"
  when: not run_online | bool or cache_data | default(false) | bool
  set_fact:
    regional_ec2_cached_data_file_loop: "{{ regional_ec2_cached_data_file_loop | default(0) | int + 1 }}"
    cached_data_filename: "cached_data/{{ inventory_hostname }}/{{ cached_data_file | default('regional_ec2') }}.{{ regional_ec2_cached_data_file_loop | default(0) | int + 1 }}.json"

- name: "NOTE: Cache/Get regional_ec2 data path"
  when: not run_online | bool or cache_data | default(false) | bool
  debug:
    msg: "File: {{ cached_data_filename }}"

- name: Cache all EC2 instances in the regions of interest.
  when: run_online | bool and cache_data | default(false) | bool
  delegate_to: localhost
  copy:
    dest: "{{ cached_data_filename }}"
    mode: "0644"
    content: "{{ regional_ec2 }}"

- name: "OFFLINE: Load all EC2 instances in the regions of interest."
  when: not run_online | bool
  set_fact:
    regional_ec2: "{% include( cached_data_filename ) %}"
The first task, if it’s still set to being “online” will execute the task, and registers the result for later. If cache_data is configured, we generate a filename for the caching, record the filename to the log (via the debug task) and then store it (using the copy task). So far, so online… but what happens when we don’t need the instance to be up and running?
In that case, we use the set_fact module, triggered by running the playbook like this: ansible-playbook run.yml -e run_online=false. This reads the cached data out of that locally stored pool of data for later use.
I recently got a new laptop, and for various reasons, I’m going to be primarily running Windows on that laptop. However, I still like having a working SSH server, running in the context of my Windows Subsystem for Linux (WSL) environment.
Initially, trying to run service ssh start failed with an error, because you need to re-execute the ssh configuration steps which are missed in a WSL environment. To fix that, run sudo apt install --reinstall openssh-server.
Once you know your service runs OK, you start digging around to find out how to start it on boot, and you’ll see lots of people saying things like “Just run a shell script that starts your first service, and then another shell script for the next service.”
Well, the frustration for me is that Linux already has this capability – the current popular version is called SystemD, but a slightly older variant is still knocking around in modern linux distributions, and it’s called SystemV Init, often referred to as just “sysv” or “init.d”.
The way that those services work is that you have an “init” file in /etc/init.d and then those files have a symbolic link into a “runlevel” directory, for example /etc/rc3.d. Each symbolic link is named S##service or K##service, where the ## represents the order in which it’s to be launched. The SSH Daemon, for example, that I want to run is created in there as /etc/rc3.d/S01ssh.
So, how do I make this work in the grander scheme of WSL? I can’t use SystemD, where I could say systemctl enable --now ssh, instead I need to add a (yes, I know) shell script, which looks in my desired runlevel directory. Runlevel 3 is the level at which network services have started, hence using that one. If I was trying to set up a graphical desktop, I’d instead be looking to use Runlevel 5, but the X Windows system isn’t ported to Windows like that yet… Anyway.
Because the rc#.d directory already has this structure for ordering and naming services to load, I can just step over this directory looking for files which match or do not match the naming convention, and I do that with this script:
#! /bin/bash
function run_rc() {
  base="$(basename "$1")"
  if [[ ${base:0:1} == "S" ]]
  then
    "$1" start
  else
    "$1" stop
  fi
}

if [ "$1" != "" ] && [ -e "$1" ]
then
  run_rc "$1"
else
  rc=3
  if [ "$1" != "" ] && [ -e "/etc/rc${$1}.d/" ]
  then
    rc="$1"
  fi
  for digit1 in {0..9}
  do
    for digit2 in {0..9}
    do
      find "/etc/rc${rc}.d/" -name "[SK]${digit1}${digit2}*" -exec "$0" '{}' \; 2>/dev/null
    done
  done
fi
I’ve put this script in /opt/wsl_init.sh
This does a bit of trickery, but basically runs the bottom block first. It loops over the digits 0 to 9 twice (giving you 00, 01, 02 and so on up to 99) and looks in /etc/rc3.d for any file containing the filename starting S or K and then with the two digits you’ve looped to by that point. Finally, it runs itself again, passing the name of the file it just found, and this is where the top block comes in.
In the top block we look at the “basename” – the part of the path supplied, without any prefixed directories attached, and then extract just the first character (that’s the ${base:0:1} part) to see whether it’s an “S” or anything else. If it’s an S (which everything there is likely to be), it executes the task like this: /etc/rc3.d/S01ssh start and this works because it’s how that script is designed! You can run one of the following instances of this command: service ssh start, /etc/init.d/ssh start or /etc/rc3.d/S01ssh start. There are other options, notably “stop” or “status”, but these aren’t really useful here.
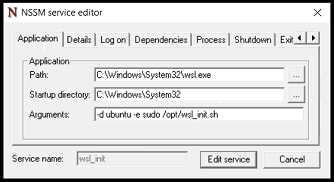
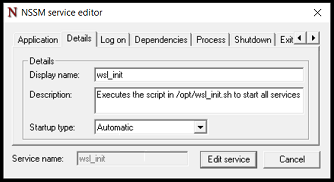
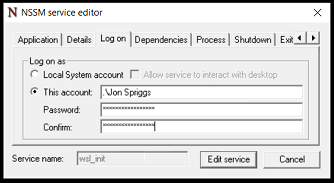
Now, how do we make Windows execute this on boot? I’m using NSSM, the “Non-sucking service manager” to add a line to the Windows System services. I placed the NSSM executable in C:\Program Files\nssm\nssm.exe, and then from a command line, ran C:\Program Files\nssm\nssm.exe install WSL_Init.
I configured it with the Application Path: C:\Windows\System32\wsl.exe and the Arguments: -d ubuntu -e sudo /opt/wsl_init.sh. Note that this only works because I’ve also got Sudo setup to execute this command without prompting for a password.
Here I invoke C:\Windows\System32\wsl.exe -d ubuntu -e sudo /opt/wsl_init.shI define the name of the service, as Services will see it, and also the description of the service.I put in MY username and My Windows Password here, otherwise I’m not running WSL in my user context, but another one.
And then I rebooted. SSH was running as I needed it.