Today I ran terragrunt apply against a IaC directory, and got this response:
╷
│ Error: Backend initialization required: please run "terraform init"
│
│ Reason: Backend configuration block has changed
│
│ The "backend" is the interface that Terraform uses to store state,
│ perform operations, etc. If this message is showing up, it means that the
│ Terraform configuration you're using is using a custom configuration for
│ the Terraform backend.
│
│ Changes to backend configurations require reinitialization. This allows
│ Terraform to set up the new configuration, copy existing state, etc. Please
│ run
│ "terraform init" with either the "-reconfigure" or "-migrate-state" flags
│ to
│ use the current configuration.
│
│ If the change reason above is incorrect, please verify your configuration
│ hasn't changed and try again. At this point, no changes to your existing
│ configuration or state have been made.
╵
ERRO[0000] Hit multiple errors:
Hit multiple errors:
exit status 1
But wait, I hear you say, Terragrunt runs terraform init for you… so what gives?
Well, in this case, the terragrunt.hcl has a dependency block, and one of those dependencies has not run properly, so… let’s fix it
Right, so for some reason the dependency won’t run. Change into that directory, and run terragrunt apply --terragrunt-source-update. Hopefully, you’ll get something like this:
Initializing the backend...

Successfully configured the backend "example"! Terraform will automatically
use this backend unless the backend configuration changes.

Initializing provider plugins...
- Reusing previous version of example/example from the dependency lock file
- Installing example/example v1.0.0...
- Installed example/example v1.0.0 (signed by Example)

Terraform has been successfully initialized!

You may now begin working with Terraform. Try running "terraform plan" to see
any changes that are required for your infrastructure. All Terraform commands
should now work.

If you ever set or change modules or backend configuration for Terraform,
rerun this command to reinitialize your working directory. If you forget, other
commands will detect it and remind you to do so if necessary.
example_module.this: Refreshing state... [id=an-example]

No changes. Your infrastructure matches the configuration.

Terraform has compared your real infrastructure against your configuration
and found no differences, so no changes are needed.

Apply complete! Resources: 0 added, 0 changed, 0 destroyed.

Outputs:
output_1 = {"some_key": "some_value"}
output_2 = "some_string"
You may find yourself having to traverse several different dependencies until you get to the one which is missing… and then it should work :)
Featured image is “Jenga” by “Mara Tr.” on Flickr and is released under a CC-BY license.
This is the first time I’ve tried to deploy this chart, and I kept getting this message:
No tags generated
Starting test...
Starting deploy...
Helm release {package} not installed. Installing...
Error: INSTALLATION FAILED: failed to authorize: failed to fetch anonymous token: unexpected status from GET request to https://ghcr.io/token?scope=repository%3A{owner}%2F{package}%3Apull&scope=repository%3Auser%2Fimage%3Apull&service=ghcr.io: 403 Forbidden
deploying "{package}": install: exit status 1
I thought this might have been an issue with the skaffold file, so I tried running this directly with helm:
$ helm pull oci://ghcr.io/{owner}/{package}
Error: failed to authorize: failed to fetch anonymous token: unexpected status from GET request to https://ghcr.io/token?scope=repository%3A{owner}%2F{package}%3Apull&scope=repository%3Auser%2Fimage%3Apull&service=ghcr.io: 403 Forbidden
Huh, that looks a bit familiar. I spent a little while checking to see whether this was something at the Kubernetes cluster, or if it was just me, and ended up finding this nugget (thanks to a steer from this post)
[Late edit: 2026-02-09] I noticed that I could just ask gh to tell me what my username was… which makes life just a touch easier! 😀 helm registry login command updated!
I love the tee command – it captures stdout [1] and puts it in a file, while then returning that output to stdout for the next process in a pipe to consume, for example:
$ ls -l | tee /tmp/output
total 1
xrwxrwxrw 1 jonspriggs jonspriggs 0 Jul 27 11:16 build.sh
$ cat /tmp/output
total 1
xrwxrwxrw 1 jonspriggs jonspriggs 0 Jul 27 11:16 build.sh
But wait, why is that useful? Well, in a script, you don’t always want to see the content scrolling past, but in the case of a problem, you might need to catch up with the logs afterwards. Alternatively, you might do something like this:
if some_process | tee /tmp/output | grep -q "some text"
then
  echo "Found 'some text' - full output:"
  cat /tmp/output
fi
This works great for stdout but what about stderr [2]? In this case you could just do:
some_process 2>&1 | tee /tmp/output
But that mashes all of stdout and stderr into the same blob.
In my case, I want to capture all the output (stdout and stderr) of a given process into a file. Only stdout is forwarded to the next process, but I still wanted to have the option to see stderr as well during processing. Enter process substitution.
With this, I run capture_out step-1 do_a_thing and then in /tmp/tmp.sometext/step-1/stdout and /tmp/tmp.sometext/step-1/stderr are the full outputs I need… but wait, I can also do:
if capture_out has_an_error something-wrong | capture_out handler check_output
then
  echo "It all went great"
else
  echo "Process failure"
  echo "--Initial process"
  # Use wc -c to check the number of characters in the file
  if [ -e "${TEMP_DATA_PATH}/has_an_error/stdout"] && [ 0 -ne "$(wc -c "${TEMP_DATA_PATH}/has_an_error/stdout")" ]
  then
    echo "----stdout:"
    cat "${TEMP_DATA_PATH}/has_an_error/stdout"
  fi
  if [ -e "${TEMP_DATA_PATH}/has_an_error/stderr"] && [ 0 -ne "$(wc -c "${TEMP_DATA_PATH}/has_an_error/stderr")" ]
  then
    echo "----stderr:"
    cat "${TEMP_DATA_PATH}/has_an_error/stderr"
  fi
  echo "--Second stage"
  if [ -e "${TEMP_DATA_PATH}/handler/stdout"] && [ 0 -ne "$(wc -c "${TEMP_DATA_PATH}/handler/stdout")" ]
  then
    echo "----stdout:"
    cat "${TEMP_DATA_PATH}/handler/stdout"
  fi
  if [ -e "${TEMP_DATA_PATH}/handler/stderr"] && [ 0 -ne "$(wc -c "${TEMP_DATA_PATH}/handler/stderr")" ]
  then
    echo "----stderr:"
    cat "${TEMP_DATA_PATH}/handler/stderr"
  fi
fi
This has become part of my normal toolkit now for logging processes. Thanks bash!
Also, thanks to ChatGPT for helping me find this structure that I’d seen before, but couldn’t remember how to do it! (it almost got it right too! Remember kids, don’t *trust* what ChatGPT gives you, use it as a research starting point, test *that* against your own knowledge, test *that* against your environment and test *that* against expected error cases too! Copy & Paste is not the best idea with AI generated code!)
Footnotes
[1] stdout is the name of the normal output text we see in a shell, it’s also sometimes referred to as “file descriptor 1” or “fd1”. You can also output to &1 with >&1 which means “send to fd1”
[2] stderr is the name of the output in a shell when an error occurs. It isn’t caught by things like some_process > /dev/null which makes it useful when you don’t want to see output, just errors. Like stdout, it’s also referred to as “file descriptor 2” or “fd2” and you can output to &2 with >&2 if you want to send stdout to stderr.
In my current role we are using Packer to build images on a Xen Orchestrator environment, use a CI/CD system to install that image into both a Xen Template and an AWS AMI, and then we use Terraform to use that image across our estate. The images we build with Packer have this stanza in it:
But, because Xen doesn’t track when a template is created, instead I needed to do something different. Enter get_xoa_template.sh.
This file contains hidden or bidirectional Unicode text that may be interpreted or compiled differently than what appears below. To review, open the file in an editor that reveals hidden Unicode characters.
Learn more about bidirectional Unicode characters
[ -z "$TEMPLATE_IS" ] && fail "Could not match this template" 4
if [ -n "$DEBUG" ]
then
echo "{\"is\": ${TEMPLATE_IS}}" | tee -a "$DEBUG"
else
echo "{\"is\": ${TEMPLATE_IS}}"
fi
}
[ -n "$(command -v xo-cli)" ] || fail "xo-cli is missing, and is a required dependency for this script. Please install it; \`sudo npm -g install xo-cli\`" 5
This script is invoked from your terraform like this:
variable "template_name" {
  default     = "SomeLinux-version.iso-"
  description = "A regex, partial or full string to match in the template name"
}

variable "poolname" {
  default = "MyPool"
}

data "external" "get_xoa_template" {
  program = [
    "/bin/bash", "${path.module}/get_xoa_template.sh",
    "--template", var.template_name,
    "--pool", var.poolname
  ]
}

data "xenorchestra_pool" "pool" {
  name_label = var.poolname
}

data "xenorchestra_template" "template" {
  name_label = data.external.get_xoa_template.result.is
  pool_id    = data.xenorchestra_pool.pool.id
}
And that’s how you do it. Oh, and if you need to pin to a specific version? Change the template_name value from the partial or regex version to the full version, like this:
variable "template_name" {
  # This assumes your image was minted at midnight on 1970-01-01
  default     = "SomeLinux-version.iso-19700101000000"
}
In my current project I am often working with Infrastructure as Code (IoC) in the form of Terraform and Terragrunt files. Before I joined the team a decision was made to use SOPS from Mozilla, and this is encrypted with an AWS KMS key. You can only access specific roles using the SAML2AWS credentials, and I won’t be explaining how to set that part up, as that is highly dependant on your SAML provider.
While much of our environment uses AWS, we do have a small presence hosted on-prem, using a hypervisor service. I’ll demonstrate this with Proxmox, as this is something that I also use personally :)
Firstly, make sure you have all of the above tools installed! For one stage, you’ll also require yq to be installed. Ensure you’ve got your shell hook setup for direnv as we’ll need this later too.
Late edit 2023-07-03: There was a bug in v0.22.0 of the terraform which didn’t recognise the environment variables prefixed PROXMOX_VE_ – a workaround by using TF_VAR_PROXMOX_VE and a variable "PROXMOX_VE_" {} block in the Terraform code was put in place for the inital publication of this post. The bug was fixed in 0.23.0 which this post now uses instead, and so as a result the use of TF_VAR_ prefixed variables was removed too.
Set up AWS Vault
AWS KMS
AWS Key Management Service (KMS) is a service which generates and makes available encryption keys, backed by the AWS service. There are *lots* of ways to cut that particular cake, but let’s do this a quick and easy way… terraform
So far, so good… but wait, you’ve authenticated to your SAML access to AWS. Let’s close that shell, and go back in again
$ cd /path/to/demo
direnv: loading /path/to/demo/.envrc
direnv: using sops
$
Ah, now we don’t have our values exported. That’s what we wanted!
What now?!
Configuring the details of the proxmox cluster
We have our .envrc file which provides our credentials (let’s pretend we’re using a shared set of credentials across all the boxes), but now we need to setup access to each of the boxes.
Let’s make our two cluster directories;
mkdir cluster_01
mkdir cluster_02
And in each of these clusters, we need to put an .envrc file with the right IP address in. This needs to check up the tree for any credentials we may have already loaded:
source_env "$(find_up ../.envrc)"
export PROXMOX_VE_ENDPOINT="https://192.0.2.1:8006" # Documentation IP address for the first cluster - change for the second cluster.
The first line works up the tree, looking for a parent .envrc file to inject, and then, with the second line, adds the Proxmox API endpoint to the end of that chain. When we run direnv allow (having logged back into our saml2aws session), we get this:
Then in the cluster_01 directory, create a directory for the code you want to run (e.g. create a VLAN might be called “VLANs/30/“) and put in it this terragrunt.hcl
This assumes you have a terraform directory called terraform-module-network/vlan in a particular place in your tree or even better, a module in your git repo, which uses the input values you’ve provided.
That double slash in the source line isn’t a typo either – this is the point in that tree that Terragrunt will copy into the directory to run terraform from too.
A quick note about includes and provider blocks
The other key thing is that the “include” block loads the values from the first matching terragrunt.hcl file in the parent directories, which in this case is the one which defined the providers block. You can’t include multiple different parent files, and you can’t have multiple generate blocks either.
Running it all together!
Now we have all our depending files, let’s run it!
user@host:~$ cd test
direnv: loading ~/test/.envrc
direnv: using sops
user@host:~/test$ saml2aws login --skip-prompt --quiet ; saml2aws exec -- bash
direnv: loading ~/test/.envrc
direnv: using sops
direnv: export +PROXMOX_VE_USERNAME +PROXMOX_VE_PASSWORD
user@host:~/test$ cd cluster_01/VLANs/30
direnv: loading ~/test/cluster_01/.envrc
direnv: loading ~/test/.envrc
direnv: using sops
direnv: export +PROXMOX_VE_ENDPOINT +PROXMOX_VE_USERNAME +PROXMOX_VE_PASSWORD
user@host:~/test/cluster_01/VLANs/30$ terragrunt apply
data.proxmox_virtual_environment_nodes.available_nodes: Reading...
data.proxmox_virtual_environment_nodes.available_nodes: Read complete after 0s [id=nodes]

Terraform used the selected providers to generate the following execution
plan. Resource actions are indicated with the following symbols:
  + create

Terraform will perform the following actions:

  # proxmox_virtual_environment_network_linux_bridge.this[0] will be created
  + resource "proxmox_virtual_environment_network_linux_bridge" "this" {
      + autostart  = true
      + comment    = "VLAN30"
      + id         = (known after apply)
      + mtu        = (known after apply)
      + name       = "vmbr30"
      + node_name  = "proxmox01"
      + ports      = [
          + "enp3s0.30",
        ]
      + vlan_aware = (known after apply)
    }

Plan: 1 to add, 0 to change, 0 to destroy.

Do you want to perform these actions?
  Terraform will perform the actions described above.
  Only 'yes' will be accepted to approve.

  Enter a value: yes
proxmox_virtual_environment_network_linux_bridge.this[0]: Creating...
proxmox_virtual_environment_network_linux_bridge.this[0]: Creation complete after 2s [id=proxmox01:vmbr30]
user@host:~/test/cluster_01/VLANs/30$
I’ve recently been working with a network estate that was a bit hard to get a handle on. It had grown organically, and was a bit tricky to allocate new network segments in. To fix this, I deployed PHPIPAM, which was super easy to setup and configure (I used the docker-compose file on the project’s docker hub page, and put it behind an NGINX server which was pre-configured with a LetsEncrypt TLS/HTTPS certificate).
PHPIPAM is a IP Address Management tool which is self-hostable. I started by setting up the “Sections” (which was the hosting environments the estate is using), and then setup the supernets and subnets in the “Subnets” section.
Already, it was much easier to understand the network topology, but now I needed to get others in to take a look at the outcome. The team I’m working with uses a slightly dated version of Keycloak to provide Single Sign-On. PHPIPAM will use SAML for authentication, which is one of the protocols that Keycloak offers. The documentation failed me a bit at this point, but fortunately a well placed ticket helped me move it along.
Setting up Keycloak
Here’s my walk through
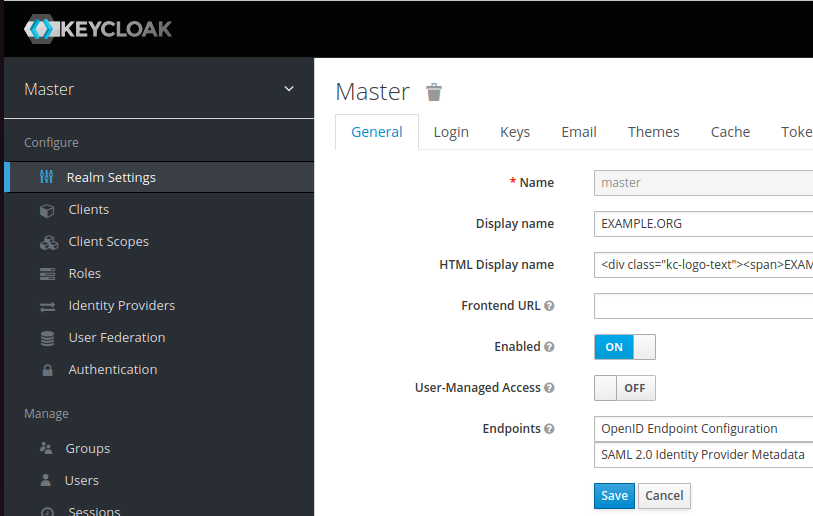
Go to “Realm Settings” in the sidebar and find the “SAML Identity Provider Metadata” (on my system it’s on the “General” tab but it might have changed position on your system). This will be an XML file, and (probably) the largest block of continuous text will be in a section marked “ds:X509Certificate” – copy this text, and you’ll need to use this as the “IDP X.509 public cert” in PHPIPAM.
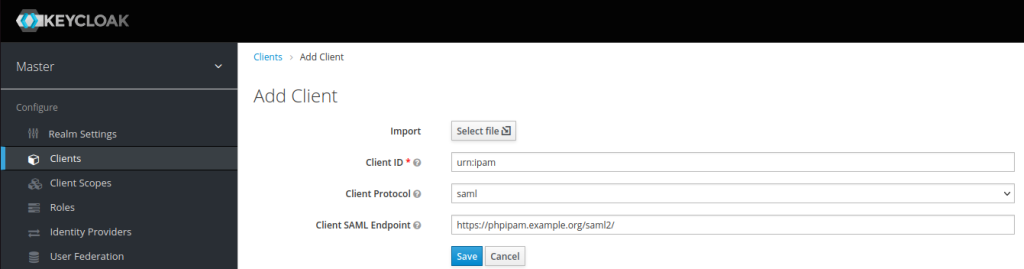
Go to “Clients” in the sidebar and click “Create”. If you want Keycloak to offer access to PHPIPAM as a link, the client ID needs to start “urn:” If you just want to use the PHPIPAM login option, give the client ID whatever you want it to be (I’ve seen some people putting in the URL of the server at this point). Either way, this needs to be unique. The client protocol is “saml” and the client SAML endpoint is the URL that you will be signing into on PHPIPAM – in my case https://phpipam.example.org/saml2/. It should look like this: Click Save to take you to the settings for this client.
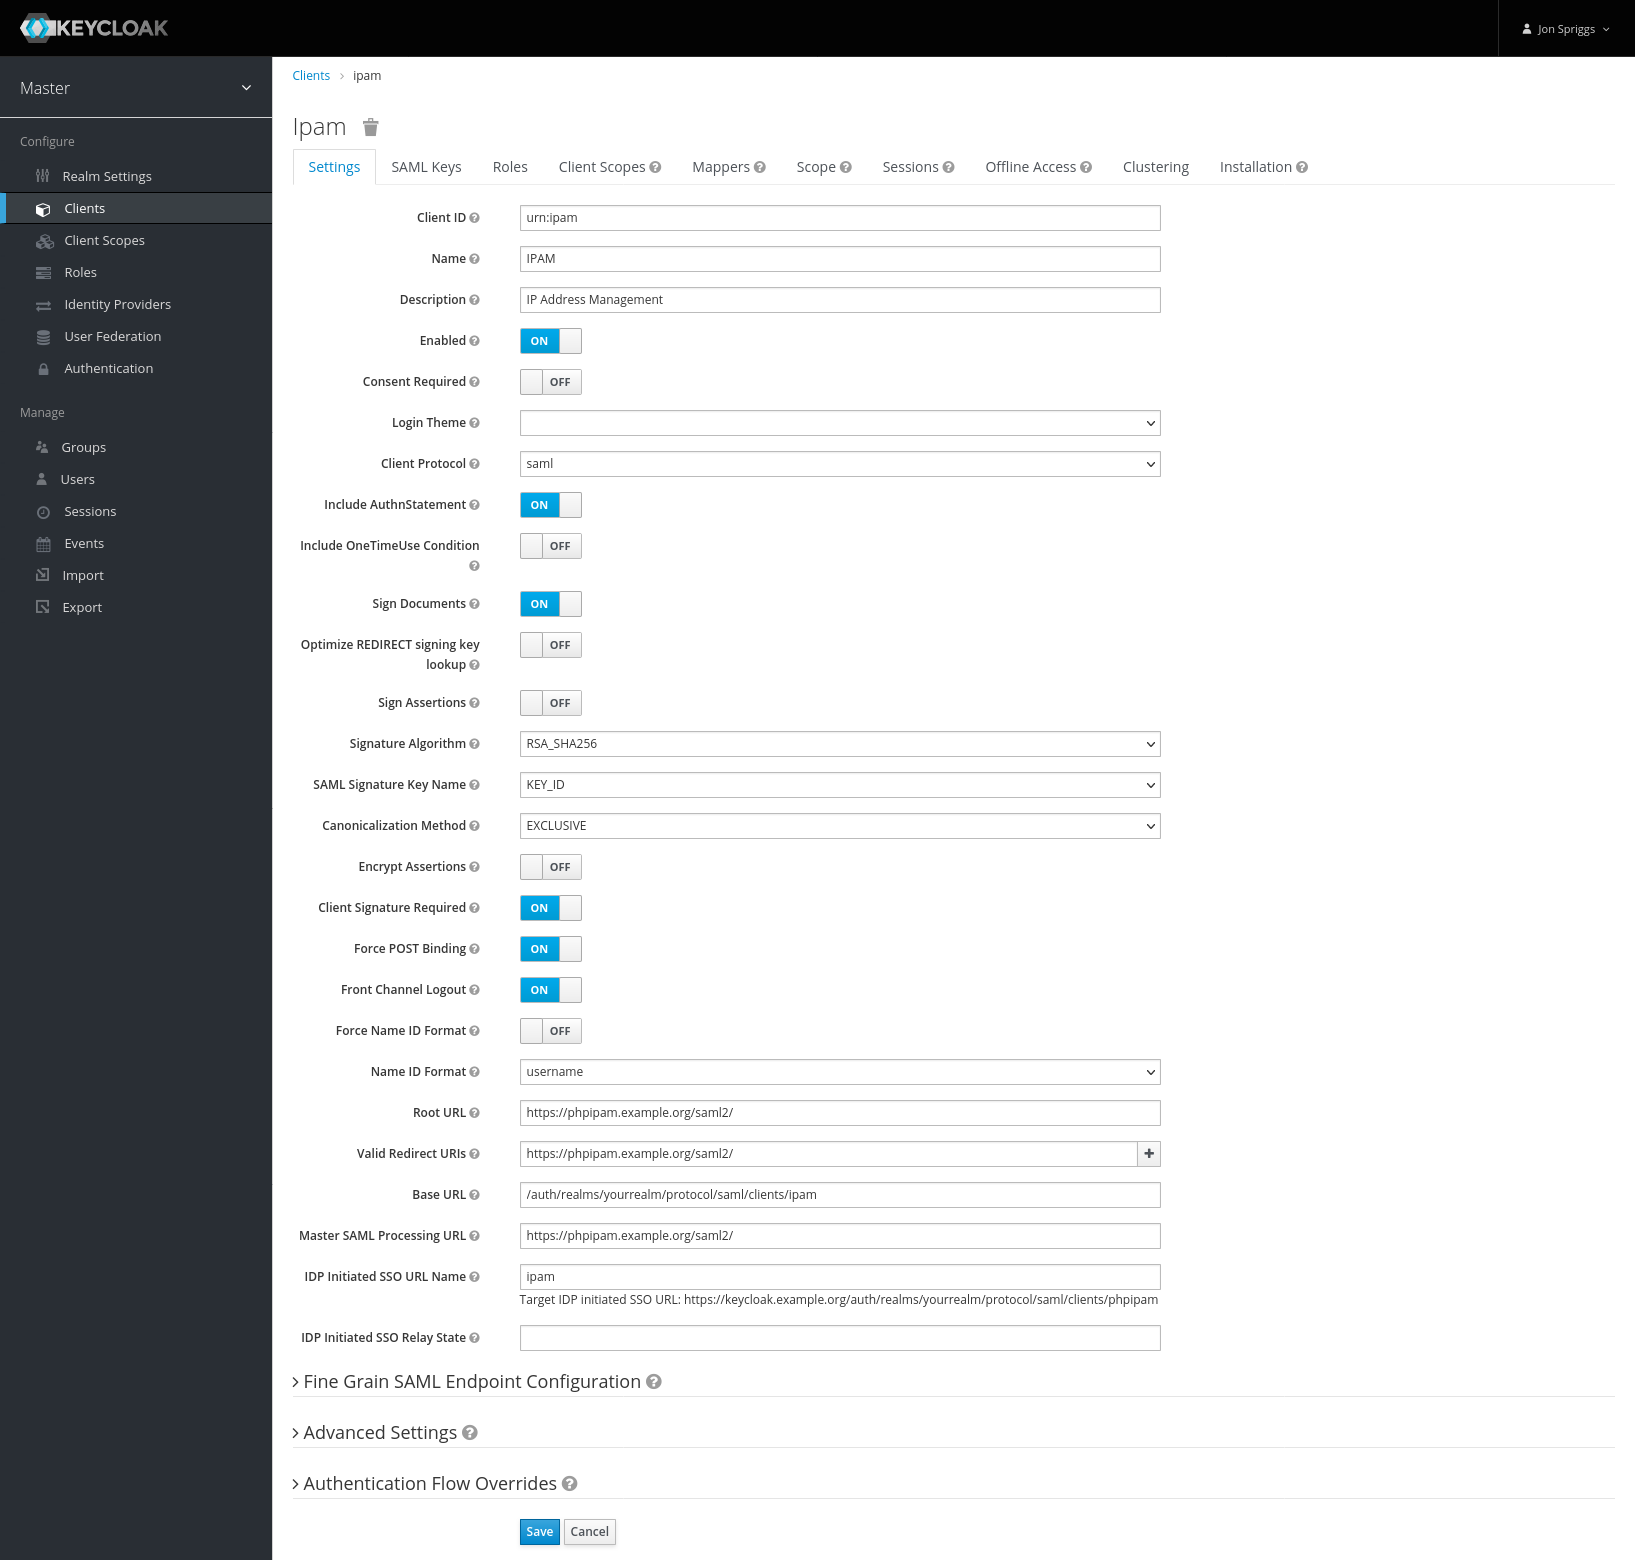
If you want Keycloak to offer a sign-in button, set the name of the button and description.
Further down the page is “Root URL” set that to the SAML Endpoint (the one ending /saml2/ from before). Also set the “Valid Redirect URIs” to that too.
Where it says “IDP Initiated SSO URL Name” put a string that will identify the client – I put phpipam, but it can be anything you want. This will populate a URL like this: https://keycloak.example.org/auth/realms/yourrealm/protocol/saml/clients/phpipam, which you’ll need as the “IDP Issuer”, “IDP Login URL” and “IDP Logout URL”. Put everything after the /auth/ in the box marked “Base URL”. It should look like this: Hit Save.
Go to the “SAML Keys” tab. Copy the private key and certificate, these are needed as the “Authn X.509 signing” cert and cert key in PHPIPAM.
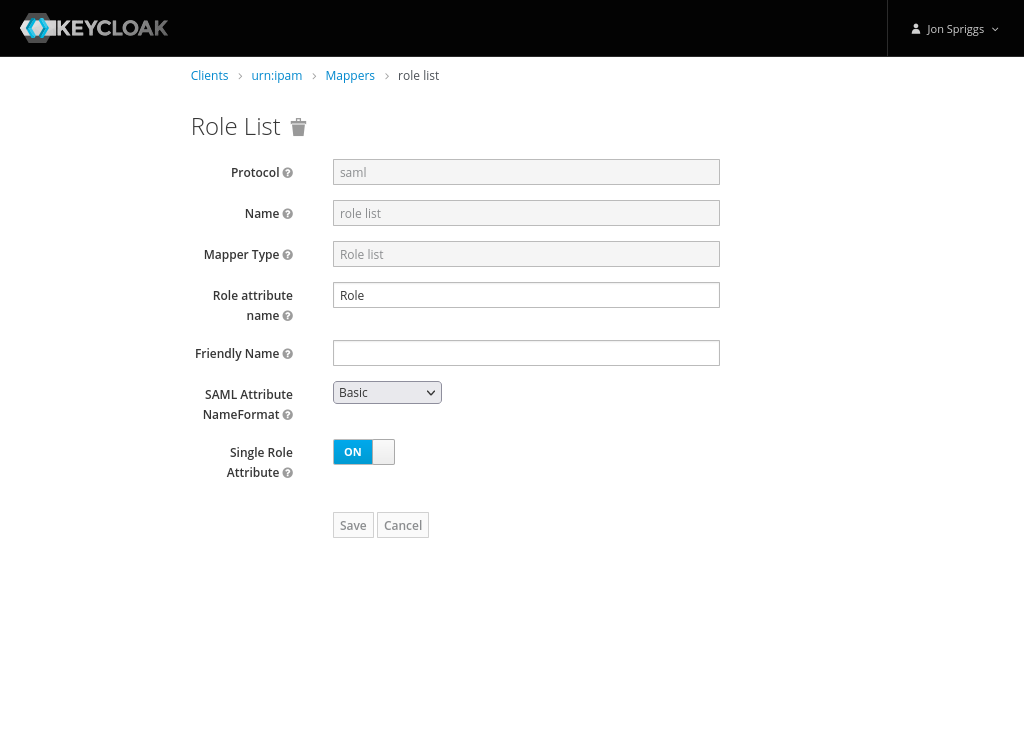
Go to the “Mappers” tab. Create each of the following mappers;
A Role List mapper, with the name of “role list”, Role Attribute Name of “Role”, no friendly name, the SAML Attribute NameFormat set to “Basic” and Single Role Attribute set to on.
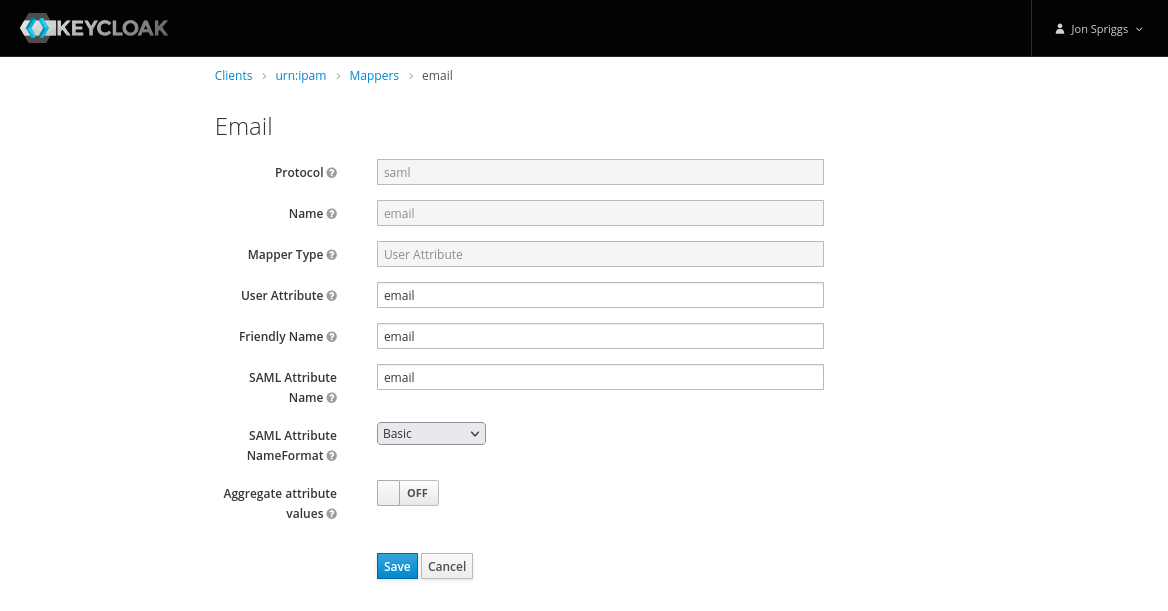
A User Attribute mapper, with the name, User Attribute, Friendly Name and SAML Attribute Name set to “email”, the SAML Attribute NameFormat set to “Basic” and Aggregate Attribute Values set to “off”.
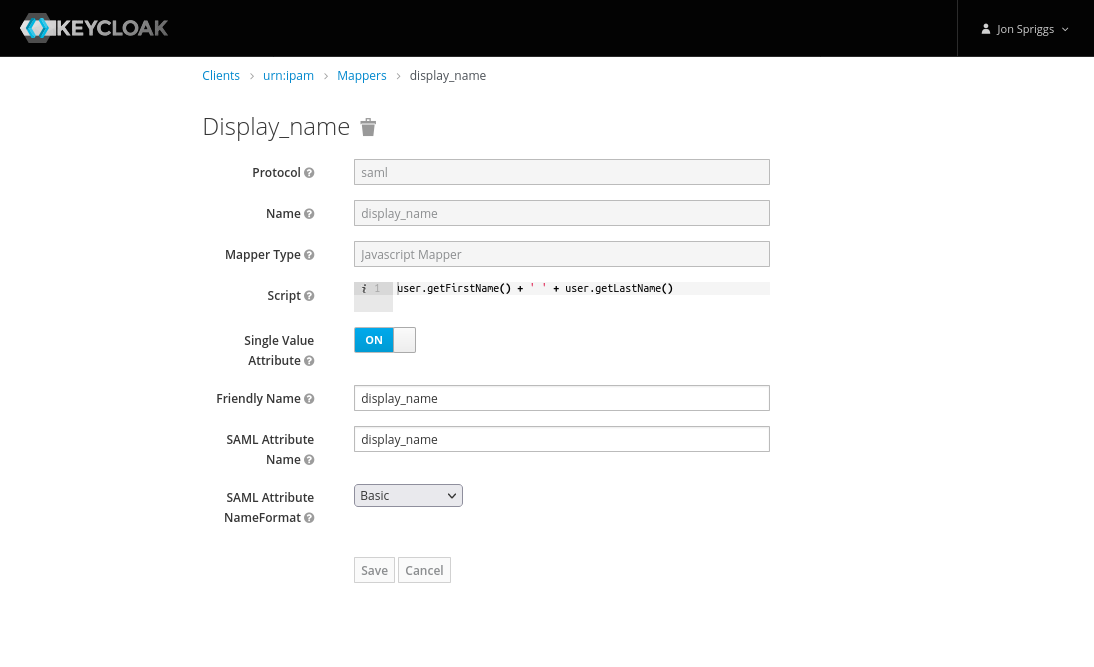
A Javascript Mapper, with the name, Friendly Name and SAML Attribute Name set to “display_name” and the SAML Attribute NameFormat set to “Basic”. The Script should be set to this single line: user.getFirstName() + ' ' + user.getLastName().
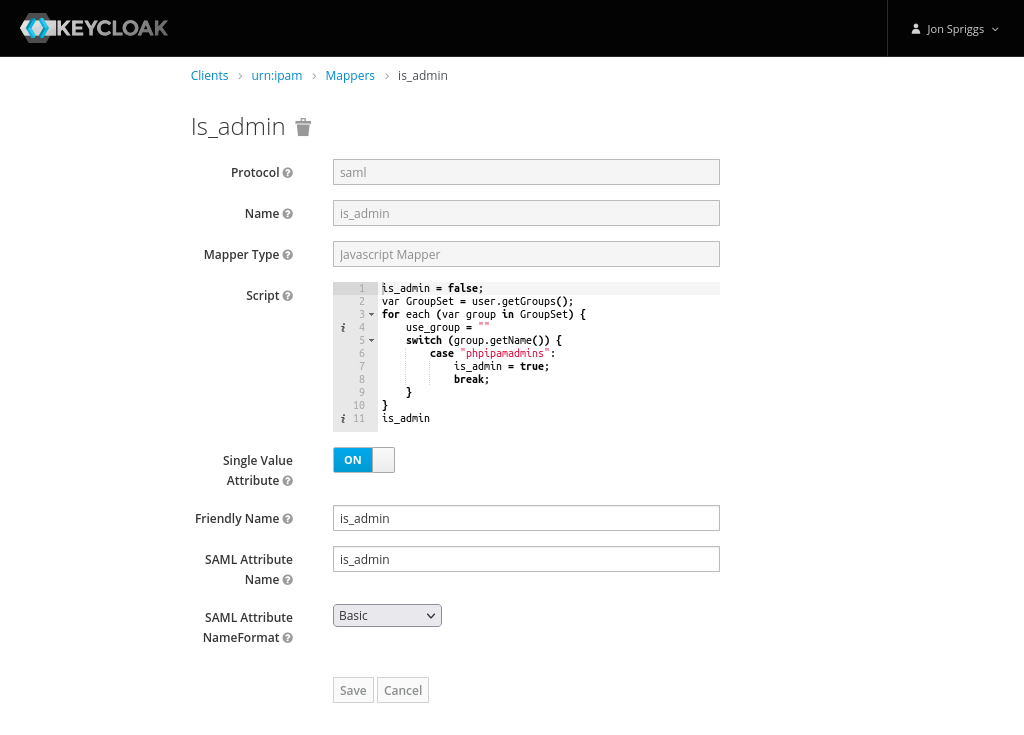
A Javascript Mapper, with the name, Friendly Name and SAML Attribute Name set to “is_admin” and the SAML Attribute NameFormat set to “Basic”.
The script should be as follows:
is_admin = false;
var GroupSet = user.getGroups();
for each (var group in GroupSet) {
    use_group = ""
    switch (group.getName()) {
        case "phpipamadmins":
            is_admin = true;
            break;
    }
}
is_admin
Create one more mapper item:
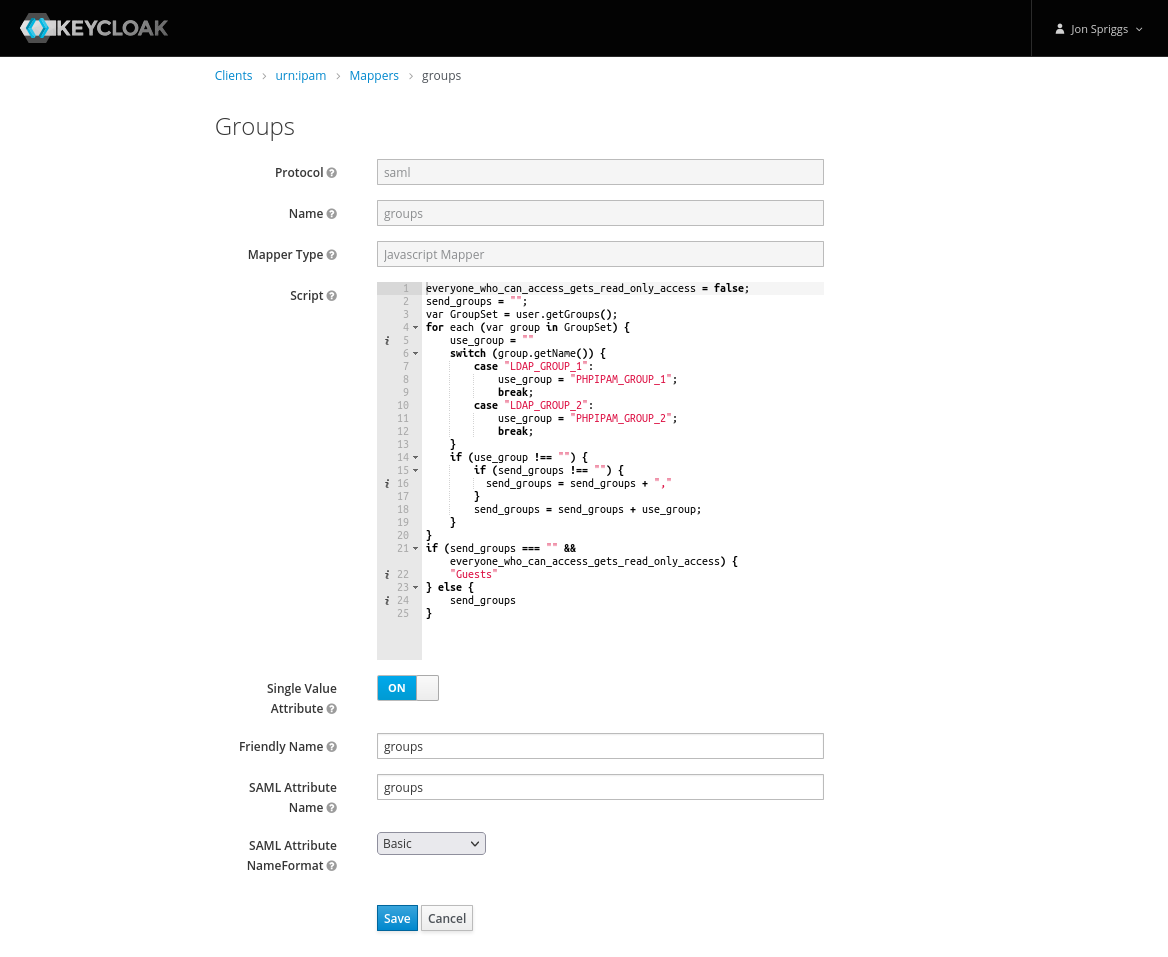
A Javascript Mapper, with the name, Friendly Name and SAML Attribute Name set to “groups” and the SAML Attribute NameFormat set to “Basic”. The script should be as follows:
everyone_who_can_access_gets_read_only_access = false;
send_groups = "";
var GroupSet = user.getGroups();
for each (var group in GroupSet) {
    use_group = ""
    switch (group.getName()) {
        case "LDAP_GROUP_1":
            use_group = "IPAM_GROUP_1";
            break;
        case "LDAP_GROUP_2":
            use_group = "IPAM_GROUP_2";
            break;
    }
    if (use_group !== "") {
        if (send_groups !== "") {
          send_groups = send_groups + ","
        }
        send_groups = send_groups + use_group;
    }
}
if (send_groups === "" && everyone_who_can_access_gets_read_only_access) {
    "Guests"
} else {
    send_groups
}
For context, the groups listed there, LDAP_GROUP_1 might be “Customer 1 Support Staff” or “ITSupport” or “Networks”, and the IPAM_GROUP_1 might be “Customer 1” or “WAN Links” or “DC Patching” – depending on the roles and functions of the teams. In my case they relate to other roles assigned to the staff member and the name of the role those people will perform in PHP IPAM. Likewise in the is_admin mapper, I’ve mentioned a group called “phpipamadmins” but this could be any relevant role that might grant someone admin access to PHPIPAM.
Late Update (2023-06-07): I’ve figured out how to enable modules now too. Create a Javascript mapper as per above, but named “modules” and have this script in it:
// Current modules as at 2023-06-07
// Some default values are set here.
noaccess       =  0;
readonly       =  1;
readwrite      =  2;
readwriteadmin =  3;
unsetperm      = -1;

var modules = {
    "*":       readonly,  "vlan":      unsetperm, "l2dom":    unsetperm,
    "devices": unsetperm, "racks":     unsetperm, "circuits": unsetperm,
    "nat":     unsetperm, "locations":  noaccess, "routing":  unsetperm,
    "pdns":    unsetperm, "customers": unsetperm
}

function updateModules(modules, new_value, list_of_modules) {
    for (var module in list_of_modules) {
        modules[module] = new_value;
    }
    return modules;
}

var GroupSet = user.getGroups();
for (var group in GroupSet) {
    switch (group.getName()) {
        case "LDAP_ROLE_3":
            modules = updateModules(modules, readwriteadmin, [
                'racks', 'devices', 'nat', 'routing'
            ]);
            break;
    }
}

var moduleList = '';

for (var key in modules) {
    if (modules.hasOwnProperty(key) && modules[key] !==-1) {
        if (moduleList !== '') {
            moduleList += ',';
        }
        moduleList += key + ':' + modules[key];
    }
}

moduleList;
OK, that’s Keycloak sorted. Let’s move on to PHPIPAM.
Setting up PHPIPAM
In the administration menu, select “Authentication Methods” and then “Create New” and select “Create new SAML2 authentication”.
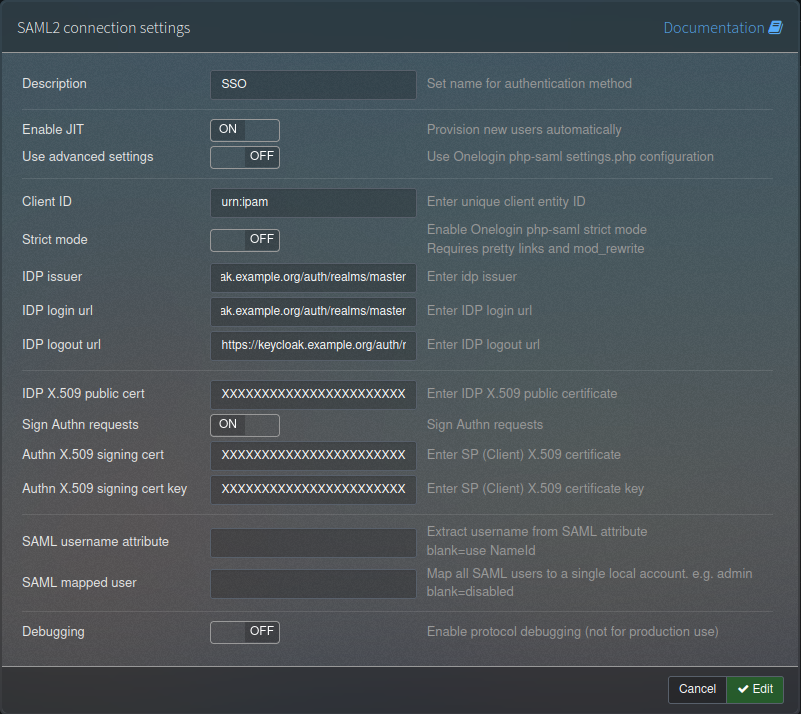
In the description field, give it a relevant name, I chose SSO, but you could call it any SSO system name. Set “Enable JIT” to “on”, leave “Use advanced settings” as “off”. In Client ID put the Client ID you defined in Keycloak, probably starting urn: or https://. Leave “Strict mode” off. Next is the IDP Issuer, IDP Login URL and IDP Logout URL, which should all be set to the same URL – the “IDP Initiated SSO URL Name” from step 4 of the Keycloak side (that was set to something like https://keycloak.example.org/auth/realms/yourrealm/protocol/saml/clients/phpipam).
After that is the certificate section – first the IDP X.509 public cert that we got in step 1, then the “Sign Authn requests” should be set to “On” and the Authn X.509 signing cert and cert key are the private key and certificate we retrieved in step 5 above. Leave “SAML username attribute” and “SAML mapped user” blank and “Debugging” set to “Off”. It should look like this:
Hit save.
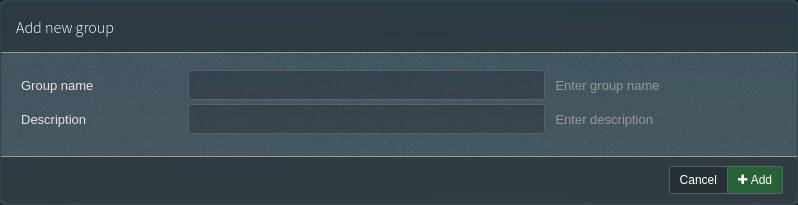
Next, any groups you specified in the groups mapper need to be defined. This is in Administration -> Groups. Create the group name and set a description.
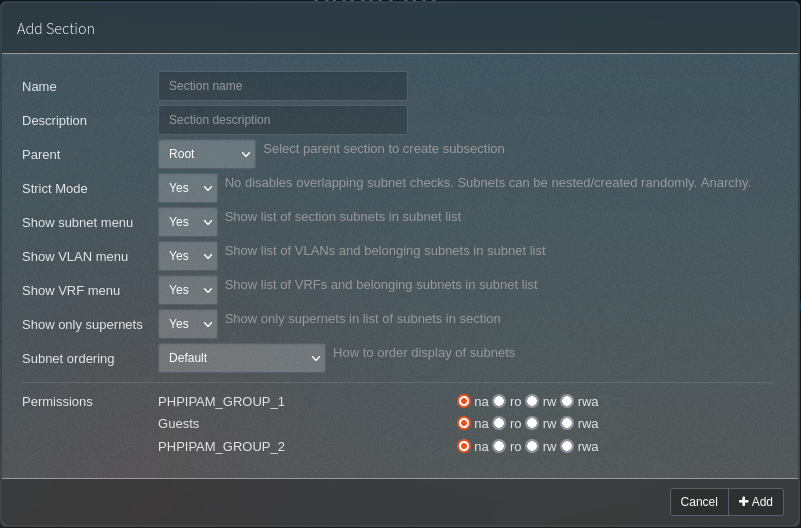
Lastly, you need to configure the sections to define whigh groups have access. Each defined group gets given four radio buttons; “na” (no access), “ro” (read only), “rw” (read write) and “rwa” (read, write and administrate).
Try logging in. It should just work!
Debugging
If it doesn’t, and checking all of the above doesn’t help, I’ve tried adding some code into the PHP file in app/saml2/index.php, currently on line 149, above where it says:
**REMEMBER THIS IS JUST FOR TESTING PURPOSES AND SHOULD BE REMOVED ASAP**
In here is an array called _attributes which will show you what has been returned from the Keycloak server when someone tries to log in. In my case, I got this:
I recently was in the situation where I had two github profiles (one work, one personal) that I needed to incorporate in projects.
My work account on this device is my “default”, I use it to push, pull and so on, but the occasional personal activities (like terminate-notice) all should be attributed to my personal account.
To make this happen, I used direnv which reads a .envrcfile in the parents of the directory you’re currently in. I created a directory for my personal projects – ~/Code/Personaland placed a .envrc file which contains:
This means that I have a specific SSH key just for my personal activities (~/.ssh/personal.id_ed25519) and I’ve got my email address defined as two environment variables – AUTHOR (who wrote the code) and COMMITTER (who added it to the tree) – both are required when you’re changing them like this!
Because I don’t ever want it to try to use my SSH Agent, I’ve added the fact that SSH_AUTH_SOCK should be empty.
As an aside, work also require Commit Signing, but I don’t want to use that for my personal projects right now, so I also discovered a new feature as-of 2020 – the environment variables GIT_CONFIG_KEY_x, GIT_CONFIG_VALUE_x and GIT_CONFIG_COUNT=x
By using these, you can override any system, global and repo-level configuration values, like this:
This ensures that I *will not* GPG Sign commits, tags or pushes.
If I accidentally cloned a repo into an unusual location, or on purpose need to make a directory or submodule a personal repo, I just copy the .envrc file into that part of the tree, run direnv allowand hey-presto! I’ve turned that area into a personal repo, without having to remember the .gitconfigstring to mark a new part of my tree as a personal one.
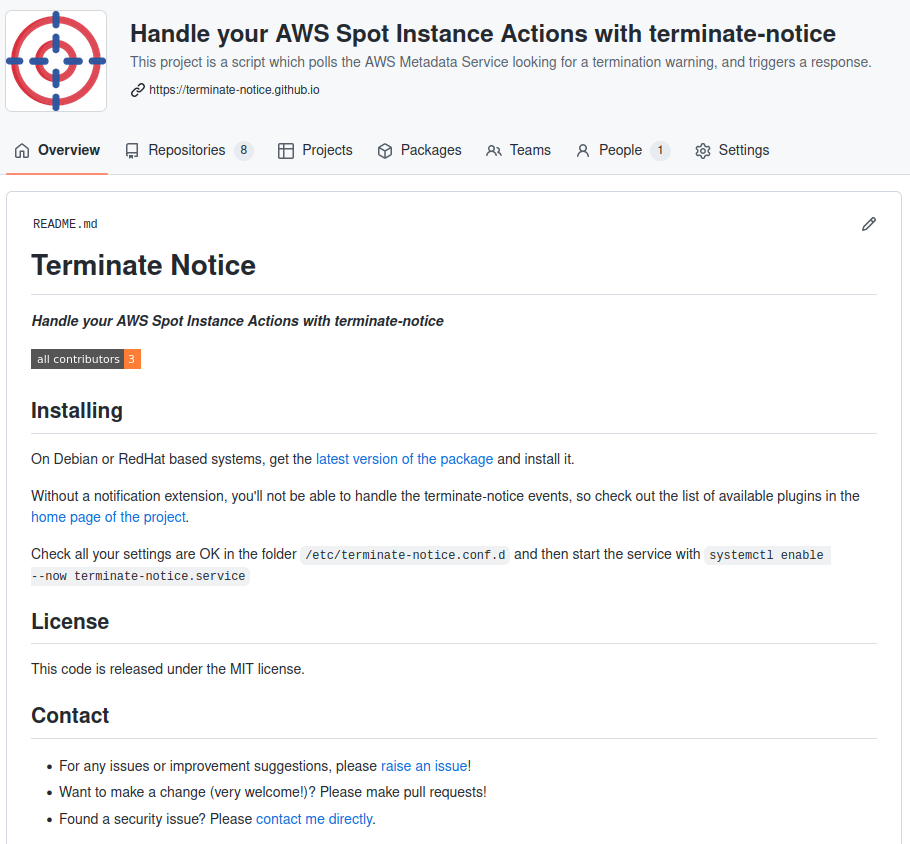
Last week I created a post talking about the new project I’ve started on Github called “Terminate-Notice” (which in hindsight isn’t very accurate – at best it’s ‘spot-instance-responses’ and at worst it’s ‘instance-rebalance-and-actions-responder’ but neither work well)… Anyway, I mentioned how I was creating RPM and DEB packages for my bash scripts and that I hadn’t put it into a repo yet.
Well, now I have, so let’s wander through how I made this work.
I have a the following files in my shell script, which are:
/usr/sbin/terminate-notice (the actual script which will run)
/usr/lib/systemd/system/terminate-notice.service (the SystemD Unit file to start and stop the script)
/usr/share/doc/terminate-notice/LICENSE (the license under which the code is released)
/etc/terminate-notice.conf.d/service.conf (the file which tells the script how to run)
These live in the root directory of my repository.
I also have the .github directory (where the things that make this script work will live), a LICENSE file (so Github knows what license it’s released under) and a README.md file (so people visiting the repo can find out about it).
A bit about Github Actions
Github Actions is a CI/CD pipeline built into Github. It responds to triggers – in our case, pushes (or uploads, in old fashioned terms) to the repository, and then runs commands or actions. The actions which will run are stored in a simple YAML formatted file, referred to as a workflow which contains some setup fields and then the “jobs” (collections of actions) themselves. The structure is as follows:
# The pretty name rendered by Actions to refer to this workflow
name: Workflow Name

# Only run this workflow when the push is an annotated tag starting v
on:
  push:
    tags:
      - 'v*'

# The workflow contains a collection of jobs, each of which has
# some actions (or "steps") to run
jobs:
  # This is used to identify the output in other jobs
  Unique_Name_For_This_Job:
    # This is the pretty name rendered in the Github UI for this job
    name: Job Name
    # This is the OS that the job will run on - typically
    # one of: ubuntu-latest, windows-latest, macos-latest
    runs-on: runner-os
    # The actual actions to perform
    steps:
      # This is a YAML list, so note where the hyphens (-) are
        # The pretty name of this step
      - name: Checkout Code
        # The name of the public collection of actions to perform
        uses: actions/checkout@v3
        # Any variables to pass into this action module
        with:
          path: "REPO"

      # This action will run a shell command
      - name: Run a command
        run: echo "Hello World"
Build a DEB package
At the simplest point, creating a DEB package is;
Create the directory structure (as above) that will unpack from your package file and put the files in the right places.
Create a DEBIAN/control file which provides enough details for your package manager to handle it.
Run dpkg-deb --build ${PATH_TO_SOURCE} ${OUTPUT_FILENAME}
Assuming the DEBIAN/control file was static and also lived in the repo, and I were just releasing the DEB file, then I could make the above work with the following steps:
name: Create the DEB

permissions:
  contents: write

on:
  push:
    tags:
      - 'v*'

jobs:
  Create_Packages:
    name: Create Package
    runs-on: ubuntu-latest
    steps:
      - name: Checkout code
        uses: actions/checkout@v3
        with:
          path: "REPO"

      - name: Copy script files around to stop .github from being added to the package then build the package
        run: |
          mkdir PKG_SOURCE
          cp -Rf REPO/usr REPO/etc REPO/DEBIAN PKG_SOURCE
          dpkg-deb --build PKG_SOURCE package.deb

      - name: Release the Package
        uses: softprops/action-gh-release@v1
        with:
          files: package.deb
But no, I had to get complicated and ALSO build an RPM file… and put some dynamic stuff in there.
Build an RPM file
RPMs are a little more complex, but not by much. RPM takes a spec file, which starts off looking like the DEBIAN/control file, and adds some “install” instructions. Let’s take a look at that spec file:
The “Name”, “Version”, “Release” and “BuildArch” values in the top of that file define what the resulting filename is (NAME_VERSION-RELEASE.BUILDARCH.rpm).
Notice that there are some “macros” which replace /etc with %{_sysconfdir}, /usr/sbin with %{_sbindir} and so on, which means that, theoretically, this RPM could be installed in an esoteric tree… but most people won’t bother.
The one quirk with this is that %{name} bit there – RPM files need to have all these sources in a directory named after the package name, which in turn is stored in a directory called SOURCES (so SOURCES/my-package for example), and then it copies the files to wherever they need to go. I’ve listed etc/config/file and usr/sbin/script but these could just have easily been file and script for all that the spec file cares.
Once you have the spec file, you run sudo rpmbuild --define "_topdir $(pwd)" -bb file.spec to build the RPM.
So, again, how would that work from a workflow YAML file perspective, assuming a static spec and source tree as described above?
name: Create the DEB

permissions:
  contents: write

on:
  push:
    tags:
      - 'v*'

jobs:
  Create_Packages:
    name: Create Package
    runs-on: ubuntu-latest
    steps:
      - name: Checkout code
        uses: actions/checkout@v3
        with:
          path: "REPO"

      - name: Copy script files around to stop .github from being added to the package then build the package
        run: |
          mkdir -p SOURCES/my-package-name
          cp -Rf REPO/usr REPO/etc SOURCES/my-package-name
          sudo rpmbuild --define "_topdir $(pwd)" -bb my-package-name.spec

      - name: Release the Package
        uses: softprops/action-gh-release@v1
        with:
          files: RPMS/my-package-name_0.0.1-1.noarch.rpm
But again, I want to be fancy (and I want to make resulting packages as simple to repeat as possible)!
So, this is my release.yml as of today:
name: Run the Release

permissions:
  contents: write

on:
  push:
    tags:
      - 'v*'

jobs:
  Create_Packages:
    name: Create Packages
    runs-on: ubuntu-latest
    steps:
      - name: Checkout code
        uses: actions/checkout@v3
        with:
          path: "REPO"

      - name: Calculate some variables
        run: |
          (
            echo "GITHUB_REPO_NAME=$(echo "${GITHUB_REPOSITORY}" | cut -d/ -f2)"
            echo "VERSION=$(echo "${GITHUB_REF_NAME}" | sed -e 's/^v//')"
            echo "DESCRIPTION=A script which polls the AWS Metadata Service looking for an 'instance action', and triggers scripts in response to the termination notice."
            echo "DEB_ARCHITECTURE=${ARCHITECTURE:-all}"
            echo "RPM_ARCHITECTURE=${ARCHITECTURE:-noarch}"
            echo "RELEASE=1"
            cd REPO
            echo "FIRST_YEAR=$(git log $(git rev-list --max-parents=0 HEAD) --date="format:%Y" --format="format:%ad")"
            echo "THIS_COMMIT_YEAR=$(git log HEAD -n1 --date="format:%Y" --format="format:%ad")"
            echo "THIS_COMMIT_DATE=$(git log HEAD -n1 --format="format:%as")"
            if [ "$FIRST_YEAR" = "$THIS_COMMIT_YEAR" ]
            then
              echo "YEAR_RANGE=$FIRST_YEAR"
            else
              echo "YEAR_RANGE=${FIRST_YEAR}-${THIS_COMMIT_YEAR}"
            fi
            cd ..
          ) >> $GITHUB_ENV

      - name: Make Directory Structure
        run: mkdir -p "SOURCES/${GITHUB_REPO_NAME}" SPECS release

      - name: Copy script files into SOURCES
        run: |
          cp -Rf REPO/[a-z]* "SOURCES/${GITHUB_REPO_NAME}"
          cp REPO/LICENSE REPO/README.md "SOURCES/${GITHUB_REPO_NAME}/usr/share/doc/${GITHUB_REPO_NAME}/"
          if grep -lr '#TAG#' SOURCES
          then
            sed -i -e "s/#TAG#/${VERSION}/" $(grep -lr '#TAG#' SOURCES)
          fi
          if grep -lr '#TAG_DATE#' SOURCES
          then
            sed -i -e "s/#TAG_DATE#/${THIS_COMMIT_YEAR}/" $(grep -lr '#TAG_DATE#' SOURCES)
          fi
          if grep -lr '#DATE_RANGE#' SOURCES
          then
            sed -i -e "s/#DATE_RANGE#/${YEAR_RANGE}/" $(grep -lr '#DATE_RANGE#' SOURCES)
          fi
          if grep -lr '#MAINTAINER#' SOURCES
          then
            sed -i -e "s/#MAINTAINER#/${MAINTAINER:-Jon Spriggs <jon@sprig.gs>}/" $(grep -lr '#MAINTAINER#' SOURCES)
          fi

      - name: Create Control File
        # Fields from https://www.debian.org/doc/debian-policy/ch-controlfields.html#binary-package-control-files-debian-control
        run: |
          mkdir -p SOURCES/${GITHUB_REPO_NAME}/DEBIAN
          (
            echo "Package:      ${GITHUB_REPO_NAME}"
            echo "Version:      ${VERSION}"
            echo "Section:      ${SECTION:-misc}"
            echo "Priority:     ${PRIORITY:-optional}"
            echo "Architecture: ${DEB_ARCHITECTURE}"
            if [ -n "${DEPENDS}" ]
            then
              echo "Depends: ${DEPENDS}"
            fi
            echo "Maintainer: ${MAINTAINER:-Jon Spriggs <jon@sprig.gs>}"
            echo "Description: ${DESCRIPTION}"
            if [ -n "${HOMEPAGE}" ]
            then
              echo "Homepage: ${HOMEPAGE}"
            fi
          ) | tee SOURCES/${GITHUB_REPO_NAME}/DEBIAN/control
          (
            echo "Files:"
            echo " *"
            echo "Copyright: ${YEAR_RANGE} ${MAINTAINER:-Jon Spriggs <jon@sprig.gs>}"
            echo "License: MIT"
            echo ""
            echo "License: MIT"
            sed 's/^/ /' "SOURCES/${GITHUB_REPO_NAME}/usr/share/doc/${GITHUB_REPO_NAME}/LICENSE"
          ) | tee SOURCES/${GITHUB_REPO_NAME}/DEBIAN/copyright

      - name: Create Spec File
        run: PATH="REPO/.github/scripts:${PATH}" create_spec_file.sh

      - name: Build DEB Package
        run: dpkg-deb --build SOURCES/${GITHUB_REPO_NAME} "${{ env.GITHUB_REPO_NAME }}_${{ env.VERSION }}_${{ env.DEB_ARCHITECTURE }}.deb"

      - name: Build RPM Package
        run: sudo rpmbuild --define "_topdir $(pwd)" -bb SPECS/${GITHUB_REPO_NAME}.spec

      - name: Confirm builds complete
        run: sudo install -m 644 -o runner -g runner $(find . -type f -name *.deb && find . -type f -name *.rpm) release/

      - name: Release
        uses: softprops/action-gh-release@v1
        with:
          files: release/*
So this means I can, within reason, drop this workflow (plus a couple of other scripts to generate the slightly more complex RPM file – see the other files in that directory structure) into another package to release it.
OH WAIT, I DID! (for the terminate-notice-slack repo, for example!) All I actually needed to do there was to change the description line, and off it went!
So, this is all well and good, but how can I distribute these? Enter Repositories.
Making a Repository
Honestly, I took most of the work here from two fantastic blog posts for creating an RPM repo and a DEB repo.
First you need to create a GPG key.
To do this, I created the following pgp-key.batch file outside my repositories tree
%echo Generating an example PGP key
Key-Type: RSA
Key-Length: 4096
Name-Real: YOUR_ORG_NAME
Name-Email: your_org_name@users.noreply.github.com
Expire-Date: 0
%no-ask-passphrase
%no-protection
%commit
Store the public.asc file to one side (you’ll need it later) and keep the private.asc safe because we need to put that into Github.
Creating Github Pages
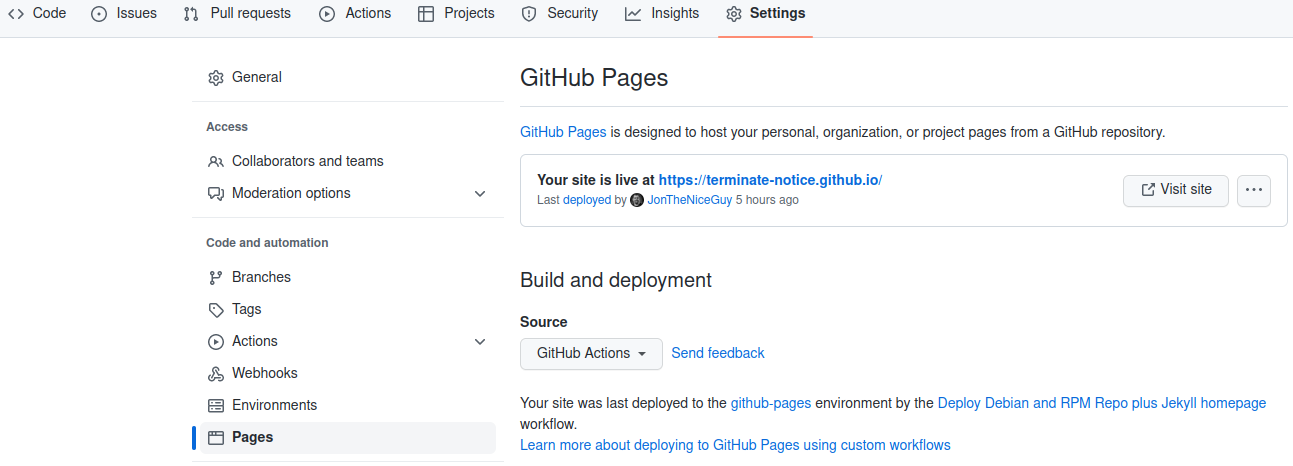
Create a new Git repository in your organisation called your-org.github.io. This marks the repository as being a Github Pages repository. Just to make that more explicit, in the settings for the repository, go to the pages section. (Note that yes, the text around this may differ, but are accurate as of 2023-03-28 in EN-GB localisation.)
Under “Source” select “GitHub Actions”.
Clone this repository to your local machine, and copy public.asc into the root of the tree with a sensible name, ending .asc.
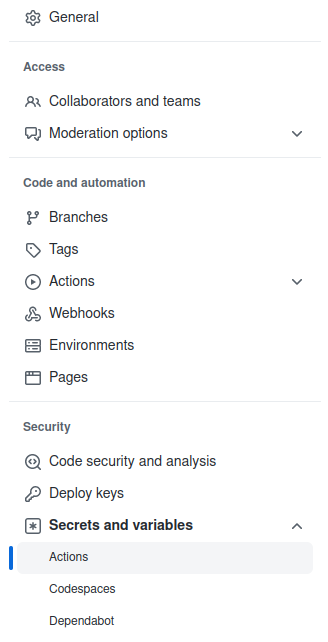
In the Github settings, find “Secrets and variables” under “Security” and pick “Actions”.
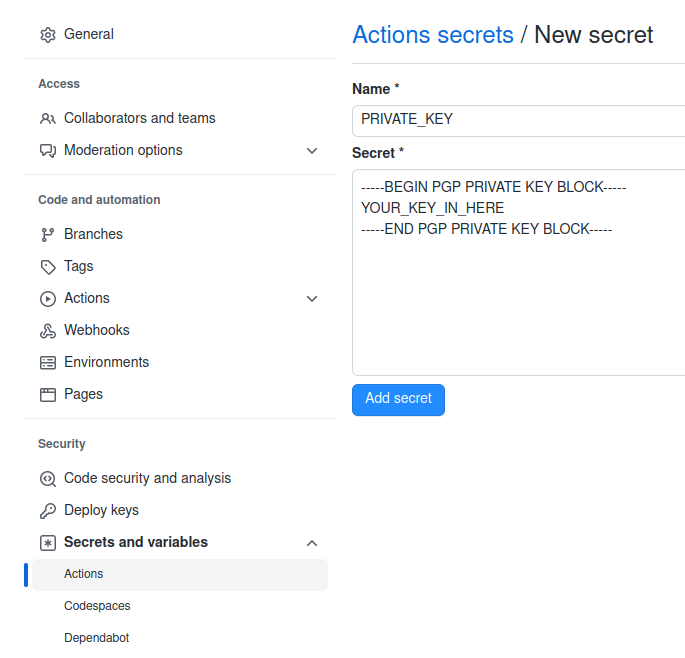
Select “New repository secret” and call it “PRIVATE_KEY”.
Now you can use this to sign things (and you will sign *SO MUCH* stuff)
Building the HTML front to your repo (I’m using Jekyll)
I’ve elected to use Jekyll because I know it, and it’s quite easy, but you should pick what works for you. My workflow for deploying these repos into the website rely on Jekyll because Github built that integration, but you’ll likely find other tools for things like Eleventy or Hugo.
Put a file called _config.yml into the root directory, and fill it with relevant content:
title: your-org
email: email_address@example.org
description: >-
  This project does stuff.
baseurl: ""
url: "https://your-org.github.io"
github_username: your-org

# Build settings
theme: minima
plugins:
  - jekyll-feed
exclude:
  - tools/
  - doc/
Naturally, make “your-org” “email_address@example.org” and the descriptions more relevant to your environment.
Next, create an index.md file with whatever is relevant for your org, but it must start with something like:
---
layout: home
title: YOUR-ORG Website
---
Here is the content for the front page.
Building the repo behind your static content
We’re back to working with Github Actions workflow files, so let’s pop that open.
I’ve basically changed the “stock” Jekyll static site Github Actions file and added every step that starts [REPO] to make the repository stuff fit in around the steps that start [JEKYLL] which build and deploy the Jekyll based site.
The key part to all this though is the step Build DEB and RPM repos which calls a script that downloads all the RPM and DEB files from the various other repository build stages and does some actions to them. Now yes, I could have put all of this into the workflow.yml file, but I think it would have made it all a bit more confusing! So, let’s work through those steps!
Making an RPM Repo
To build a RPM repo you get and sign each of the RPM packages you want to offer. You do this with this command:
Then, once you have all your RPM files signed, you then run a command called createrepo_c (available in Debian archives – Github Actions doesn’t have a RedHat based distro available at this time, so I didn’t look for the RPM equivalent). This creates the repository metadata, and finally you sign that file, like this:
gpg --detach-sign --armor repodata/repomd.xml
Making a DEB Repo
To build a DEB repo you get each of the DEB packages you want to offer in a directory called pool/main (you can also call “main” something else – for example “contrib”, “extras” and so on).
Once you have all your files, you create another directory called dists/stable/main/binary-all into which we’ll run a command dpkg-scanpackages to create the list of the available packages. Yes, “main” could also be called “contrib”, “extras” and “stable” could be called “testing” or “preprod” or the name of your software release (like “jaunty”, “focal” or “warty”). The “all” after the word “binary” is the architecture in question.
dpkg-scanpackages creates an index of the packages in that directory including the version number, maintainer and the cryptographic hashes of the DEB files.
We zip (using gzip and bzip2) the Packages file it creates to improve the download speeds of these files, and then make a Release file. This in turn has the cryptographic hashes of each of the Packages and zipped Packages files, which in turn is then signed with GPG.
Ugh, that was MESSY
Making the repository available to your distributions
RPM repos have it quite easy here – there’s a simple file, that looks like this:
The distribution user simply downloads this file, puts it into /etc/yum.sources.d/org-name.repo and now all the packages are available for download. Woohoo!
DEB repos are a little harder.
First, download the public key – https://org-name.github.io/public.asc and put it in /etc/apt/keyrings/org-name.asc. Next, create file in /etc/apt/sources.list.d/org-name.list with this line in:
deb [arch=all signed-by=/etc/apt/keyrings/org-name.asc] https://org-name.github.io/deb stable main
And now they can install whatever packages they want too!
Doing this the simple way
Of course, this is all well-and-good, but if you’ve got a simple script you want to package, please don’t hesitate to use the .github directory I’m using for terminate-notice, which is available in the -skeleton repo and then to make it into a repo, you can reuse the .github directory in the terminate-notice.github.io repo to start your adventure.
During some debugging of an issue with our AWS Spot Instances at work, a colleague noticed that we weren’t responding to the Instance Actions that AWS sends when it’s due to shut down a spot instance.
I’m working on a new project, and I am using Multipass on an Ubuntu machine to provision some virtual machines on my local machine using cloudinit files. All good so far!
I wanted to expose one of the services I’ve created to the bridged network (so I can run avahi-daemon), and did this by running multipass launch -n vm01 --network enp3s0 when, what should I see but: launch failed: The bridging feature is not implemented on this backend. OH NO!