A photo of a conch shell in front of a blurry photo frame.

Why (and how) I’ve started writing my Shell Scripts in Python

I’ve been using Desktop Linux for probably 15 years, and Server Linux for more like 25 in one form or another. One of the things you learn to write pretty early on in Linux System Administration is Bash Scripting. Here’s a great example

#!/bin/bash

i = 0
until [ $i -eq 10 ]
do
  print "Jon is the best!"
  (( i += 1 ))
done

Bash scripts are pretty easy to come up with, you just write the things you’d type into the interactive shell, and it does those same things for you! Yep, it’s pretty hard not to love Bash for a shell script. Oh, and it’s portable too! You can write the same Bash script for one flavour of Linux (like Ubuntu), and it’s probably going to work on another flavour of Linux (like RedHat Enterprise Linux, or Arch, or OpenWRT).

But. There comes a point where a Bash script needs to be more than just a few commands strung together.

At work, I started writing a “simple” installer for a Kubernetes cluster – it provisions the cloud components with Terraform, and then once they’re done, it then starts talking to the Kubernetes API (all using the same CLI tools I use day-to-day) to install other components and services.

When the basic stuff works, it’s great. When it doesn’t work, it’s a bit of a nightmare, so I wrote some functions to put logs in a common directory, and another function to gracefully stop the script running when something fails, and then write those log files out to the screen, so I know what went wrong. And then I gave it to a colleague, and he ran it, and things broke in a way that didn’t make sense for either of us, so I wrote some more functions to trap that type of error, and try to recover from them.

And each time, the way I tested where it was working (or not working) was to just… run the shell script, and see what it told me. There had to be a better way.

Enter Python

Python earns my vote for a couple of reasons (and they might not be right for you!)

  • I’ve been aware of the language for some time, and in fact, had patched a few code libraries in the past to use Ansible features I wanted.
  • My preferred IDE (Integrated Desktop Environment), Visual Studio Code, has a step-by-step debugger I can use to work out what’s going on during my programming
  • It’s still portable! In fact, if anything, it’s probably more portable than Bash, because the version of Bash on the Mac operating system – OS X is really old, so lots of “modern” features I’d expect to be in bash and associate tooling isn’t there! Python is Python everywhere.
  • There’s an argument parsing tool built into the core library, so if I want to handle things like ./myscript.py --some-long-feature "option-A" --some-long-feature "option-B" -a -s -h -o -r -t --argument I can do, without having to remember how to write that in Bash (which is a bit esoteric!)
  • And lastly, for now at least!, is that Python allows you to raise errors that can be surfaced up to other parts of your program

Given all this, my personal preference is to write my shell scripts now in Python.

If you’ve not written python before, variables are written without any prefix (like you might have seen $ in PHP) and any flow control (like if, while, for, until) as well as any functions and classes use white-space indentation to show where that block finishes, like this:

def do_something():
  pass

if some_variable == 1:
  do_something()
  and_something_else()
  while some_variable < 2:
    some_variable = some_variable * 2

Starting with Boilerplate

I start from a “standard” script I use. This has a lot of those functions I wrote previously for bash, but with cleaner code, and in a way that’s a bit more understandable. I’ll break down the pieces I use regularly.

Starting the script up

Here’s the first bit of code I always write, this goes at the top of everything

#!/usr/bin/env python3
import logging
logger = logging

This makes sure this code is portable, but is always using Python3 and not Python2. It also starts to logging engine.

At the bottom I create a block which the “main” code will go into, and then run it.

def main():
  logger.basicConfig(level=logging.DEBUG)
  logger.debug('Started main')

if __name__ == "__main__":
    main()

Adding argument parsing

There’s a standard library which takes command line arguments and uses them in your script, it’s called argparse and it looks like this:

#!/usr/bin/env python3
# It's convention to put all the imports at the top of your files
import argparse
import logging
logger = logging

def process_args():
  parser=argparse.ArgumentParser(
    description="A script to say hello world"
  )

  parser.add_argument(
    '--verbose', # The stored variable can be found by getting args.verbose
    '-v',
    action="store_true",
    help="Be more verbose in logging [default: off]"
  )

  parser.add_argument(
    'who', # This is a non-optional, positional argument called args.who
    help="The target of this script"
  )
  args = parser.parse_args()

  if args.verbose:
      logger.basicConfig(level=logging.DEBUG)
      logger.debug('Setting verbose mode on')
  else:
      logger.basicConfig(level=logging.INFO)

  return args

def main():
  args=process_args()

  print(f'Hello {args.who}')
  # Using f'' means you can include variables in the string
  # You could instead do printf('Hello %s', args.who)
  # but I always struggle to remember in what order I wrote things!

if __name__ == "__main__":
    main()

The order you put things in makes a lot of difference. You need to have the if __name__ == "__main__": line after you’ve defined everything else, but then you can put the def main(): wherever you want in that file (as long as it’s before the if __name__). But by having everything in one file, it feels more like those bash scripts I was talking about before. You can have imports (a bit like calling out to other shell scripts) and use those functions and classes in your code, but for the “simple” shell scripts, this makes most sense.

So what else do we do in Shell scripts?

Running commands

This is class in it’s own right. You can pass a class around in a variable, but it has functions and properties of it’s own. It’s a bit chunky, but it handles one of the biggest issues I have with bash scripts – capturing both the “normal” output (stdout) and the “error” output (stderr) without needing to put that into an external file you can read later to work out what you saw, as well as storing the return, exit or error code.

# Add these extra imports
import os
import subprocess

class RunCommand:
    command = ''
    cwd = ''
    running_env = {}
    stdout = []
    stderr = []
    exit_code = 999

    def __init__(
      self,
      command: list = [], 
      cwd: str = None,
      env: dict = None,
      raise_on_error: bool = True
    ):
        self.command = command
        self.cwd = cwd
        
        self.running_env = os.environ.copy()

        if env is not None and len(env) > 0:
            for env_item in env.keys():
                self.running_env[env_item] = env[env_item]

        logger.debug(f'exec: {" ".join(command)}')

        try:
            result = subprocess.run(
                command,
                cwd=cwd,
                capture_output=True,
                text=True,
                check=True,
                env=self.running_env
            )
            # Store the result because it worked just fine!
            self.exit_code = 0
            self.stdout = result.stdout.splitlines()
            self.stderr = result.stderr.splitlines()
        except subprocess.CalledProcessError as e:
            # Or store the result from the exception(!)
            self.exit_code = e.returncode
            self.stdout = e.stdout.splitlines()
            self.stderr = e.stderr.splitlines()

        # If verbose mode is on, output the results and errors from the command execution
        if len(self.stdout) > 0:
            logger.debug(f'stdout: {self.list_to_newline_string(self.stdout)}')
        if len(self.stderr) > 0:
            logger.debug(f'stderr: {self.list_to_newline_string(self.stderr)}')

        # If it failed and we want to raise an exception on failure, record the command and args
        # then Raise Away!
        if raise_on_error and self.exit_code > 0:
            command_string = None
            args = []
            for element in command:
                if not command_string:
                    command_string = element
                else:
                    args.append(element)

            raise Exception(
                f'Error ({self.exit_code}) running command {command_string} with arguments {args}\nstderr: {self.stderr}\nstdout: {self.stdout}')

    def __repr__(self) -> str: # Return a string representation of this class
        return "\n".join(
            [
               f"Command: {self.command}",
               f"Directory: {self.cwd if not None else '{current directory}'}",
               f"Env: {self.running_env}",
               f"Exit Code: {self.exit_code}",
               f"nstdout: {self.stdout}",
               f"stderr: {self.stderr}" 
            ]
        )

    def list_to_newline_string(self, list_of_messages: list):
        return "\n".join(list_of_messages)

So, how do we use this?

Well… you can do this: prog = RunCommand(['ls', '/tmp', '-l']) with which we’ll get back the prog object. If you literally then do print(prog) it will print the result of the __repr__() function:

Command: ['ls', '/tmp', '-l']
Directory: current directory
Env: <... a collection of things from your environment ...>
Exit Code: 0
stdout: total 1
drwx------ 1 root  root  0 Jan 1 01:01 somedir
stderr:

But you can also do things like:

for line in prog.stdout:
  print(line)

or:

try:
  prog = RunCommand(['false'], raise_on_error=True)
catch Exception as e:
  logger.error(e)
  exit(e.exit_code)

Putting it together

So, I wrote all this up into a git repo, that you’re more than welcome to take your own inspiration from! It’s licenced under an exceptional permissive license, so you can take it and use it without credit, but if you want to credit me in some way, feel free to point to this blog post, or the git repo, which would be lovely of you.

Github: JonTheNiceGuy/python_shell_script_template

Featured image is “The Conch” by “Kurtis Garbutt” on Flickr and is released under a CC-BY license.

A padlock and chain on a rusted gate

Using #NetworkFirewall and #Route53 #DNS #Firewall to protect a private subnet’s egress traffic in #AWS

I wrote this post in January 2023, and it’s been languishing in my Drafts folder since then. I’ve had a look through it, and I can’t see any glaring reasons why I didn’t publish it so… it’s published… Enjoy 😁

If you’ve ever built a private subnet in AWS, you know it can be a bit tricky to get updates from the Internet – you end up having a NAT gateway or a self-managed proxy, and you can never be 100% certain that the egress traffic isn’t going somewhere you don’t want it to.

In this case, I wanted to ensure that outbound HTTPS traffic was being blocked if the SNI didn’t explicitly show the DNS name I wanted to permit through, and also, I only wanted specific DNS names to resolve. To do this, I used AWS Network Firewall and Route 53 DNS Firewall.

I’ve written this blog post, and followed along with this, I’ve created a set of terraform files to represent the steps I’ve taken.

The Setup

Let’s start this story from a simple VPC with three private subnets for my compute resources, and three private subnets for the VPC Endpoints for Systems Manager (SSM).

Here’s our network diagram, with the three subnets containing the VPC Endpoints at the top, and the three instances at the bottom.

I’ve created a tag in my Github repo at this “pre-changes” state, called step 1.

At this point, none of those instances can reach anything outside the network, with the exception of the SSM environment. So, we can’t install any packages, we can’t get data from outside the network or anything similar.

Getting Protected Internet Access

In order to get internet access, we need to add 4 things;

  1. An internet gateway
  2. A NAT gateway in each AZ
  3. Which needs three new subnets
  4. And three Elastic IP addresses
  5. Route tables in all the subnets

To clarify, a NAT gateway acts like a DSL router. It hides the source IP address of outbound traffic behind a single, public IP address (using an Elastic IP from AWS), and routes any return traffic back to wherever that traffic came from. To reduce inter-AZ data transfer rates, I’m putting one in each AZ, but if there’s not a lot of outbound traffic or the outbound traffic isn’t critical enough to require resiliency, this could all be centralised to a single NAT gateway. To put a NAT gateway in each AZ, you need a subnet in each AZ, and to get out to the internet (by whatever means you have), you need an internet gateway and route tables for how to reach the NAT and internet gateways.

We also should probably add, at this point, four additional things.

  1. The Network Firewall
  2. Subnets for the Firewall interfaces
  3. Stateless Policy
  4. Stateful Policy

The Network Firewall acts like a single appliance, and uses a Gateway Load Balancer to present an interface into each of the availability zones. It has a stateless policy (which is very fast, but needs to address both inbound and outbound traffic flows) to do IP and Port based filtering (referred to as “Layer 3” filtering) and then specific traffic can be passed into a stateful policy (which is slower) to do packet and flow inspection.

In this case, I only want outbound HTTPS traffic to be passed, so my stateless rule group is quite simple;

  • VPC range on any port → Internet on TCP/443; pass to Stateful rule groups
  • Internet on TCP/443 → VPC range on any port; pass to Stateful rule groups

I have two stateful rule groups, one is defined to just allow access out to example.com and any relevant subdomains, using the “Domain List” stateful policy item. The other allows access to example.org and any relevant subdomains, using a Suricata stateful policy item, to show the more flexible alternative route. (Suricata has lots more filters than just the SNI value, you can check for specific SSH versions, Kerberos CNAMEs, SNMP versions, etc. You can also add per-rule logging this way, which you can’t with the Domain List route).

These are added to the firewall policy, which also defines that if a rule doesn’t match a stateless rule group, or an established flow doesn’t match a stateful rule group, then it should be dropped.

New network diagram with more subnets and objects, but essentially, as described in the paragraphs above. Traffic flows from the instances either down towards the internet, or up towards the VPCe.

I’ve created a tag in my Github repo at this state, with the firewall, NAT Gateway and Internet Gateway, called step 2.

So far, so good… but why let our users even try to resolve the DNS name of a host they’re not permitted to reach. Let’s turn on DNS Firewalling too.

Turning on Route 53 DNS Firewall

You’ll notice that in the AWS Network Firewall, I didn’t let DNS out of the network. This is because, by default, AWS enables Route 53 as it’s local resolver. This lives on the “.2” address of the VPC, so in my example environment, this would be 198.18.0.2. Because it’s a local resolver, it won’t cross the Firewall exiting to the internet. You can also make Route 53 use your own DNS servers for specific DNS resolution (for example, if you’re running an Active Directory service inside your network).

Any Network Security Response team members you have working with you would appreciate it if you’d turn on DNS Logging at this point, so I’ll do it too!

In March 2021, AWS announced “Route 53 DNS Firewall”, which allow this DNS resolver to rewrite responses, or even to completely deny the existence of a DNS record. With this in mind, I’m going to add some custom DNS rules.

The first thing I want to do is to only permit traffic to my specific list of DNS names – example.org, example.com and their subdomains. DNS quite likes to terminate DNS names with a dot, signifying it shouldn’t try to resolve any higher up the chain, so I’m going to make a “permitted domains” DNS list;

example.com.
example.org.
*.example.com.
*.example.org.

Nice and simple! Except, this also stops me from being able to access the instances over SSM, so I’ll create a separate “VPCe” DNS list:

ssm.ex-ample-1.amazonaws.com.
*.ssm.ex-ample-1.amazonaws.com.
ssmmessages.ex-ample-1.amazonaws.com.
*.ssmmessages.ex-ample-1.amazonaws.com.
ec2messages.ex-ample-1.amazonaws.com.
*.ec2messages.ex-ample-1.amazonaws.com.

Next I create a “default deny” DNS list:

*.

And then build a DNS Firewall Policy which allows access to the “permitted domains”, “VPCe” lists, but blocks resolution of any “default deny” entries.

I’ve created a tag in my Github repo at this state, with the Route 53 DNS Firewall configured, called step 3.

In conclusion…

So there we have it. While the network is not “secure” (there’s still a few gaps here) it’s certainly MUCH more secure than it was, and it certainly would take a lot more work for anyone with malicious intent to get your content out.

Feel free to have a poke around, and leave comments below if this has helped or is of interest!

"Killer travel plug and socket board" by "Ashley Basil" on Flickr

Testing and Developing WordPress Plugins using Vagrant to provide the test environment

I keep trundling back to a collection of WordPress plugins that I really love. And sometimes I want to contribute patches to the plugin.

I don’t want to develop against this server (that would be crazy… huh… right… no one does that… *cough*) but instead, I want a nice, fresh and new WordPress instance to just check that it works the way I was expecting.

So, I created a little Vagrant environment, just for testing WordPress plugins. I clone the repository for the plugin, and create a “TestingEnvironment” directory in there.

I then create the following Vagrantfile.

Vagrant.configure("2") do |config|
  config.vm.box = "ubuntu/jammy64"
  # This will create an IP address in the range 192.168.64.0/24 (usually)
  config.vm.network "private_network", type: "dhcp"
  # This loads the git repo for the plugin into /tmp/git_repo
  config.vm.synced_folder "../", "/tmp/git_repo"

  # If you've got vagrant-cachier, this will speed up apt update/install operations
  if Vagrant.has_plugin?("vagrant-cachier")
    config.cache.scope = :box
  end

  config.vm.provision "shell", inline: <<-SHELL

    # Install Dependencies
    apt-get update
    apt-get install -y apache2 libapache2-mod-fcgid php-fpm mysql-server php-mysql git

    # Set up Apache
    a2enmod proxy_fcgi setenvif
    a2enconf "$(basename "$(ls /etc/apache2/conf-available/php*)" .conf)"
    systemctl restart apache2
    rm -f /var/www/html/index.html

    # Set up WordPress
    bash /vagrant/root_install_wordpress.sh
  SHELL
end

Next, let’s create that root_install_wordpress.sh file.

#! /bin/bash

# Allow us to run commands as www-data
chsh -s /bin/bash www-data
# Let www-data access files in the web-root.
chown -R www-data:www-data /var/www

# Install wp-cli system-wide
curl -s -S -O https://raw.githubusercontent.com/wp-cli/builds/gh-pages/phar/wp-cli.phar
mv wp-cli.phar /usr/local/bin/wp
chmod +x /usr/local/bin/wp

# Slightly based on 
# https://www.a2hosting.co.uk/kb/developer-corner/mysql/managing-mysql-databases-and-users-from-the-command-line
echo "CREATE DATABASE wp;" | mysql -u root
echo "CREATE USER 'wp'@'localhost' IDENTIFIED BY 'wp';" | mysql -u root
echo "GRANT ALL PRIVILEGES ON wp.* TO 'wp'@'localhost';" | mysql -u root
echo "FLUSH PRIVILEGES;" | mysql -u root

# Execute the generic install script
su - www-data -c bash -c /vagrant/user_install_wordpress.sh
# Install any plugins with this script
su - www-data -c bash -c /vagrant/customise_wordpress.sh
# Log the path to access
echo "URL: http://$(sh /vagrant/get_ip.sh) User: admin Password: password"

Now we have our dependencies installed and our database created, let’s get WordPress installed with user_install_wordpress.sh.

#! /bin/bash

# Largely based on https://d9.hosting/blog/wp-cli-install-wordpress-from-the-command-line/
cd /var/www/html
# Install the latest WP into this directory
wp core download --locale=en_GB
# Configure the database with the credentials set up in root_install_wordpress.sh
wp config create --dbname=wp --dbuser=wp --dbpass=wp --locale=en_GB
# Skip the first-run-wizard
wp core install --url="http://$(sh /vagrant/get_ip.sh)" --title=Test --admin_user=admin --admin_password=password --admin_email=example@example.com --skip-email
# Setup basic permalinks
wp option update permalink_structure ""
# Flush the rewrite schema based on the permalink structure
wp rewrite structure ""

Excellent. This gives us a working WordPress environment. Now we need to add our customisation – the plugin we’re deploying. In this case, I’ve been tweaking the “presenter” plugin so here’s the customise_wordpress.sh code:

#! /bin/bash

cd /var/www/html/wp-content/plugins
git clone /tmp/git_repo presenter --recurse-submodules
wp plugin activate presenter

Actually, that /tmp/git_repo path is a call-back to this line in the Vagrantfile: config.vm.synced_folder "../", "/tmp/git_repo".

And there you have it; a vanilla WordPress install, with the plugin installed and ready to test. It only took 4 years to write up a blog post for it!

As an alternative, you could instead put the plugin you’re working with in a subdirectory of the Vagrantfile and supporting files, then you’d just need to change that git clone /tmp/git_repo line to git clone /vagrant/MyPlugin – but then you can’t offer this to the plugin repo as a PR, can you? 😀

Featured image is “Killer travel plug and socket board” by “Ashley Basil” on Flickr and is released under a CC-BY license.

"Fishing fleet" by "Nomad Tales" on Flickr

Using Terraform to select multiple Instance Types for an Autoscaling Group in AWS

Tale as old as time, the compute instance type you want to use in AWS is highly contested (or worse yet, not as available in every availability zone in your region)! You plead with your TAM or AM “Please let us have more of that instance type” only to be told “well, we can put in a request, but… haven’t you thought about using a range of instance types”?

And yes, I’ve been on both sides of that conversation, sadly.

The commented terraform

# This is your legacy instance_type variable. Ideally we'd have
# a warning we could raise at this point, telling you not to use
# this variable, but... it's not ready yet.
variable "instance_type" {
  description = "The legacy single-instance size, e.g. t3.nano. Please migrate to instance_types ASAP. If you specify instance_types, this value will be ignored."
  type        = string
  default     = null
}

# This is your new instance_types value. If you don't already have
# some sort of legacy use of the instance_type variable, then don't
# bother with that variable or the locals block below!
variable "instance_types" {
  description = "A list of instance sizes, e.g. [t2.nano, t3.nano] and so on."
  type        = list(string)
  default     = null
}

# Use only this locals block (and the value further down) if you
# have some legacy autoscaling groups which might use individual
# instance_type sizes.
locals {
  # This means if var.instance_types is not defined, then use it,
  # otherwise create a new list with the single instance_type
  # value in it!
  instance_types = var.instance_types != null ? var.instance_types : [ var.instance_type ]
}

resource "aws_launch_template" "this" {
  # The prefix for the launch template name
  # default "my_autoscaling_group"
  name_prefix = var.name

  # The AMI to use. Calculated outside this process.
  image_id = data.aws_ami.this.id

  # This block ensures that any new instances are created
  # before deleting old ones.
  lifecycle {
    create_before_destroy = true
  }

  # This block defines the disk size of the root disk in GB
  block_device_mappings {
    device_name = data.aws_ami.centos.root_device_name
    ebs {
      volume_size = var.disksize # default "10"
      volume_type = var.disktype # default "gp2"
    }
  }

  # Security Groups to assign to the instance. Alternatively
  # create a network_interfaces{} block with your
  # security_groups = [ var.security_group ] in it.
  vpc_security_group_ids = [ var.security_group ]

  # Any on-boot customizations to make.
  user_data = var.userdata
}

resource "aws_autoscaling_group" "this" {
  # The name of the Autoscaling Group in the Web UI
  # default "my_autoscaling_group"
  name = var.name

  # The list of subnets into which the ASG should be deployed.
  vpc_zone_identifier = var.private_subnets
  # The smallest and largest number of instances the ASG should scale between
  min_size            = var.min_rep
  max_size            = var.max_rep

  mixed_instances_policy {
    launch_template {
      # Use this template to launch all the instances
      launch_template_specification {
        launch_template_id = aws_launch_template.this.id
        version            = "$Latest"
      }

      # This loop can either use the calculated value "local.instance_types"
      # or, if you have no legacy use of this module, remove the locals{}
      # and the variable "instance_type" {} block above, and replace the
      # for_each and instance_type values (defined as "local.instance_types")
      # with "var.instance_types".
      #
      # Loop through the whole list of instance types and create a
      # set of "override" values (the values are defined in the content{}
      # block).
      dynamic "override" {
        for_each = local.instance_types
        content {
          instance_type = local.instance_types[override.key]
        }
      }
    }

    instances_distribution {
      # If we "enable spot", then make it 100% spot.
      on_demand_percentage_above_base_capacity = var.enable_spot ? 0 : 100
      spot_allocation_strategy                 = var.spot_allocation_strategy
      spot_max_price                           = "" # Empty string is "on-demand price"
    }
  }
}

So what is all this then?

This is two Terraform resources; an aws_launch_template and an aws_autoscaling_group. These two resources define what should be launched by the autoscaling group, and then the settings for the autoscaling group.

You will need to work out what instance types you want to use (e.g. “must have 16 cores and 32 GB RAM, have an x86_64 architecture and allow up to 15 Gigabit/second throughput”)

When might you use this pattern?

If you have been seeing messages like “There is no Spot capacity available that matches your request.” or “We currently do not have sufficient <size> capacity in the Availability Zone you requested.” then you need to consider diversifying the fleet that you’re requesting for your autoscaling group. To do that, you need to specify more instance types. To achieve this, I’d use the above code to replace (something like) one of the code samples below.

If you previously have had something like this:

resource "aws_launch_configuration" "this" {
  iam_instance_profile        = var.instance_profile_name
  image_id                    = data.aws_ami.this.id
  instance_type               = var.instance_type
  name_prefix                 = var.name
  security_groups             = [ var.security_group ]
  user_data_base64            = var.userdata
  spot_price                  = var.spot_price

  root_block_device {
    volume_size = var.disksize
  }

  lifecycle {
    create_before_destroy = true
  }
}

resource "aws_autoscaling_group" "this" {
  capacity_rebalance   = false
  launch_configuration = aws_launch_configuration.this.id
  max_size             = var.max_rep
  min_size             = var.min_rep
  name                 = var.name
  vpc_zone_identifier  = var.private_subnets
}

Or this:

resource "aws_launch_template" "this" {
  lifecycle {
    create_before_destroy = true
  }

  block_device_mappings {
    device_name = data.aws_ami.this.root_device_name
    ebs {
      volume_size = var.disksize
    }
  }

  iam_instance_profile {
    name = var.instance_profile_name
  }

  network_interfaces {
    associate_public_ip_address = true
    security_groups             = local.node_security_groups
  }

  image_id      = data.aws_ami.this.id
  name_prefix   = var.name
  instance_type = var.instance_type
  user_data     = var.userdata

  instance_market_options {
    market_type = "spot"
    spot_options {
      spot_instance_type = "one-time"
    }
  }

  metadata_options {
    http_tokens                 = var.imds == 1 ? "optional" : "required"
    http_endpoint               = "enabled"
    http_put_response_hop_limit = 1
  }
}

resource "aws_autoscaling_group" "this" {
  name                = var.name
  vpc_zone_identifier = var.private_subnets
  min_size            = var.min_rep
  max_size            = var.max_rep

  launch_template {
    id      = aws_launch_template.this.id
    version = "$Latest"
  }
}

Then this new method is a much better idea :) Even more so if you had two launch templates to support spot and non-spot instance types!

Hat-tip to former colleague Paul Moran who opened my eyes to defining your fleet of variable instance types, as well as to my former customer (deliberately unnamed) and my current employer who both stumbled into the same documentation issue. Without Paul’s advice with my prior customer’s issue I’d never have known what I was looking for this time around!

Featured image is “Fishing fleet” by “Nomad Tales” on Flickr and is released under a CC-BY-SA license.

"Traffic" by "Make Lemons" on Flickr

A Quick Guide to setting up Traefik on a single Docker node inside your home network

I have a small server running Docker for services at home. There are several services which will want to use HTTP, but I can’t have them all sharing the same port without a reverse proxy to manage how to route the traffic to the containers!

This is my guide to how I got Traefik set up to serve HTTP and HTTPS traffic.

The existing setup for one service

Currently, I have phpIPAM which has the following docker-compose.yml file:

version: '3'

services:
  web:
    image: phpipam/phpipam-www:latest
    ports:
      - "80:80"
    cap_add:
      - NET_ADMIN
      - NET_RAW
    environment:
      - TZ=Europe/London
      - IPAM_DATABASE_HOST=db
      - IPAM_DATABASE_USER=someuser
      - IPAM_DATABASE_PASS=somepassword
      - IPAM_DATABASE_WEBHOST=%
    restart: unless-stopped
    volumes:
      - phpipam-logo:/phpipam/css/images/logo
      - phpipam-ca:/usr/local/share/ca-certificates:ro
    depends_on:
      - db

  cron:
    image: phpipam/phpipam-cron:latest
    cap_add:
      - NET_ADMIN
      - NET_RAW
    environment:
      - TZ=Europe/London
      - IPAM_DATABASE_HOST=db
      - IPAM_DATABASE_USER=someuser
      - IPAM_DATABASE_PASS=somepassword
      - SCAN_INTERVAL=1h
    restart: unless-stopped
    volumes:
      - phpipam-ca:/usr/local/share/ca-certificates:ro
    depends_on:
      - db

  db:
    image: mariadb:latest
    environment:
      - MYSQL_USER=someuser
      - MYSQL_PASSWORD=somepassword
      - MYSQL_RANDOM_ROOT_PASSWORD=yes
      - MYSQL_DATABASE=phpipam
    restart: unless-stopped
    volumes:
      - phpipam-db-data:/var/lib/mysql

volumes:
  phpipam-db-data:
  phpipam-logo:
  phpipam-ca:

The moment I want to bind another service to TCP/80, I get an error because we’ve already used TCP/80 for phpIPAM. Enter Traefik. Let’s stop the docker container with docker compose down and build our Traefik setup.

Traefik Setup

I always store my docker compose files in /opt/docker/<servicename>, so let’s create a directory for traefik; sudo mkdir -p /opt/docker/traefik

The (“dynamic”) configuration file

Next we need to create a configuration file called traefik.yaml

# Ensure all logs are sent to stdout for `docker compose logs`
accessLog: {}
log: {}

# Enable docker provider but don't switch it on by default
providers:
  docker:
    exposedByDefault: false
    # Select this as the docker network to connect from traefik to containers
    # This is defined in the docker-compose.yaml file
    network: web

# Enable the API and Dashboard on TCP/8080
api:
  dashboard: true
  insecure: true
  debug: true

# Listen on both HTTP and HTTPS
entryPoints:
  http:
    address: ":80"
    http: {}
  https:
    address: ":443"
    http:
      tls: {}

With the configuration file like this, we’ll serve HTTPS traffic with a self-signed TLS certificate on TCP/443 and plain HTTP on TCP/80. We have a dashboard on TCP/8080 served over HTTP, so make sure you don’t expose *that* to the public internet!

The Docker-Compose File

Next we need the docker-compose file for Traefik, so let’s create docker-compose.yaml

version: '3'

networks:
  web:
    name: web
    attachable: true

services:
  traefik:
    image: traefik:latest
    ports:
      - "8080:8080"
      - "443:443"
      - "80:80"
    networks:
      - web
    volumes:
      - /var/run/docker.sock:/var/run/docker.sock
      - ./traefik.yaml:/etc/traefik/traefik.yaml
    restart: always

There are a few parts here which aren’t spelled out on the Traefik quickstart! Firstly, if you don’t define a network, it’ll create one using the docker-compose file path, so probably traefik_traefik or traefik_default, which is not what we want! So, we’ll create one called “web” (but you can call it whatever you want. On other deployments, I’ve used the name “traefik” but I found it tedious to remember how to spell that each time). This network needs to be “attachable” so that other containers can use it later.

You then attach that network to the traefik service, and expose the ports we need (80, 443 and 8080).

And then start the container with docker compose up -d

alpine-docker:/opt/docker/traefik# docker compose up -d
[+] Running 2/2
 ✔ Network web                  Created   0.2s 
 ✔ Container traefik-traefik-1  Started   1.7s 
alpine-docker:/opt/docker/traefik#

Adding Traefik to phpIPAM

Going back to phpIPAM, So that Traefik can reach the containers, and so that the container can reach it’s database, we need two network statements now; the first is the “external” network for the traefik connection which we called “web“. The second is the inter-container network so that the “web” service can reach the “db” service, and so that the “cron” service can reach the “db” service. So we need to add that to the start of /opt/docker/phpipam/docker-compose.yaml, like this;

networks:
  web:
    name: web
    external: true
    attachable: true
  ipam:
    name: ipam

We then need to add both networks that to the “web” container, like this:

services:
  web:
    image: phpipam/phpipam-www:latest
    networks:
      - ipam
      - web
# ...... and the rest of the config

Remove the “ports” block and replace it with an expose block like this:

services:
  web:
# ...... The rest of the config for this service
    ## Don't bind to port 80 - we use traefik now
    # ports:
    #   - "80:80"
    ## Do expose port 80 for Traefik to use 
    expose:
      - 80
# ...... and the rest of the config

And just the inter-container network to the “cron” and “db” containers, like this:

  cron:
    image: phpipam/phpipam-cron:latest
    networks:
      - ipam
# ...... and the rest of the config

  db:
    image: mariadb:latest
    networks:
      - ipam
# ...... and the rest of the config

There’s one other set of changes we need to make in the “web” service, which are to enable Traefik to know that this is a container to look at, and to work out what traffic to send to it, and that’s to add labels, like this:

services:
  web:
# ...... The rest of the config for this service
    labels:
      - traefik.enable=true
      - traefik.http.routers.phpipam.rule=Host(`phpipam.homenet`)
# ...... and the rest of the config

Right, now we run docker compose up -d

alpine-docker:/opt/docker/phpipam# docker compose up -d
[+] Running 4/4
 ✔ Network ipam              Created   0.4s 
 ✔ Container phpipam-db-1    Started   1.4s 
 ✔ Container phpipam-cron-1  Started   2.1s 
 ✔ Container phpipam-web-1   Started   2.6s 
alpine-docker:/opt/docker/phpipam#

If you notice, this doesn’t show to the web network being created (because it was already created by Traefik) but does bring up the container.

Checking to make sure it’s working

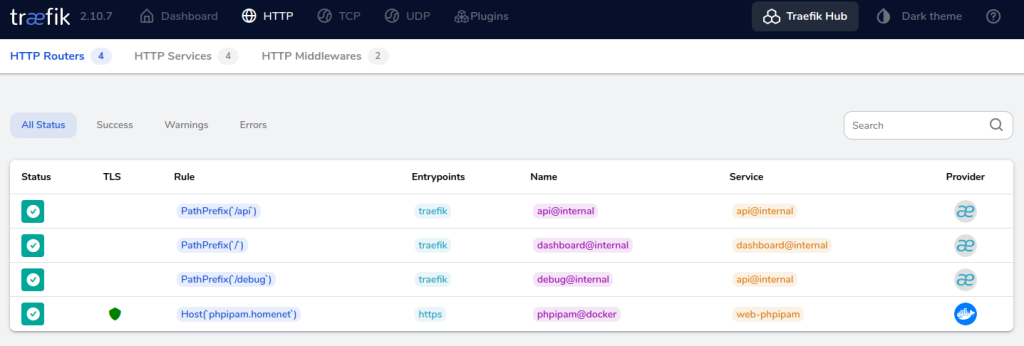
A screenshot of the traefik dashboard showing the phpipam service added.

If we head to the Traefik dashboard (http://your-docker-server:8080) you’ll see the phpipam service identified there… yey!

Better TLS with Lets Encrypt

So, at home I actually have a DNS suffix that is a real DNS name. For the sake of the rest of this documentation, assume it’s homenet.sprig.gs (but it isn’t 😁).

This DNS space is hosted by Digital Ocean, so I can use a DNS Challenge with Lets Encrypt to provide hostnames which are not publically accessible. If you’re hosting with someone else, then that’s probably also available – check the Traefik documentation for your specific variables. The table on that page (as of 2023-12-30) shows the environment variables you need to pass to Traefik to get LetsEncrypt working.

A screen capture of the table on the Traefik website, showing the environment variables needed to use the Lets Encrypt DNS challenge with Digital Ocean

As you can see here, I just need to add the value DO_AUTH_TOKEN, which is an API key. I went to the Digital Ocean console, and navigated to the API panel, and added a new “Personal Access Token”, like this:

Screen capture of part of the Digital Ocean console showing the personal access token, showing I needed "read" and "write" capabilities.

Notice that the API key needed to provide both “Read” and “Write” capabilities, and has been given a name so I can clearly see it’s purpose.

Changing the traefik docker-compose.yaml file

In /opt/docker/traefik/docker-compose.yaml we need to add that new environment variable; DO_AUTH_TOKEN, like this:

services:
  traefik:
# ...... The rest of the config for this service
    environment:
      DO_AUTH_TOKEN: dop_v1_decafbad1234567890abcdef....1234567890
# ...... and the rest of the config

Changing the traefik.yaml file

In /opt/docker/traefik/traefik.yaml we need to tell it to use Let’s Encrypt. Add this block to the end of the file:

certificatesResolvers:
  letsencrypt:
    acme:
      email: yourname@example.org
      storage: acme.json
      dnsChallenge:
        provider: digitalocean
        delayBeforeCheck: 1 # Minutes
        resolvers:
          - "1.1.1.1:53"
          - "8.8.8.8:53"

Obviously change the email address to a valid one for you! I hit a few issues with the value specified in the documentation for delayBeforeCheck, as their value of “0” wasn’t long enough for the DNS value to be propogated around the network – 1 minute is enough though!

I also had to add the resolvers, as my local network has a caching DNS server, so I’d never have seen the updates! You may be able to remove both those values from your files.

Now you’ve made all the changes to the Traefik service, restart it with docker compose down ; docker compose up -d

Changing the services to use Lets Encrypt

We need to add one final label to the /opt/docker/phpipam/docker-compose.yaml file, which is this one:

services:
  web:
# ...... The rest of the config for this service
    labels:
      - traefik.http.routers.phpipam.tls.certresolver=letsencrypt
# ...... and the rest of the config

Also, update your .rule=Host(`hostname`) to use the actual DNS name you want to be able to use, then restart the docker container.

phpIPAM doesn’t like trusting proxies, unless explicitly told to, so I also had add an environment variable IPAM_TRUST_X_FORWARDED=true to the /opt/docker/phpipam/docker-compose.yaml file too, because phpIPAM tried to write the HTTP scheme for any links which came up, based on what protocol it thought it was running – not what the proxy was telling it it was being accessed as!

Debugging any issues

If you have it all setup as per the above, and it isn’t working, go into /opt/docker/traefik/traefik.yaml and change the stanza which says log: {} to:

log:
  level: DEBUG

Be aware though, this adds a LOT to your logs! (But you won’t see why your ACME requests have failed without it). Change it back to log: {} once you have it working again.

Adding your next service

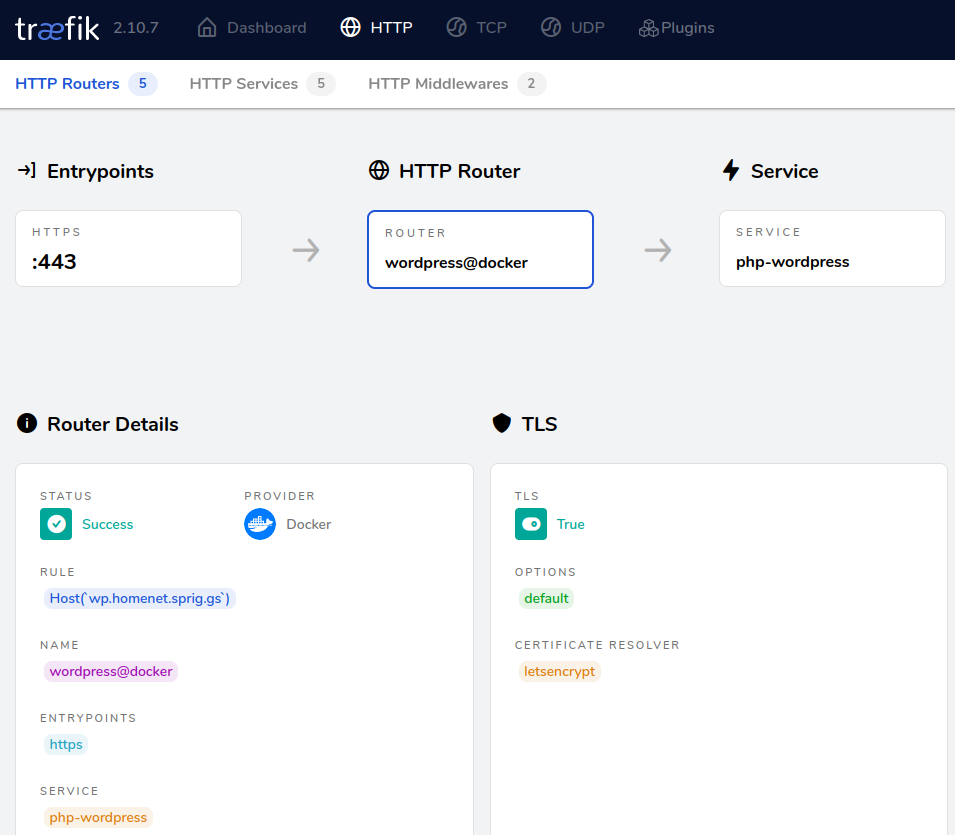
I now want to add that second service to my home network – WordPress. Here’s /opt/docker/wordpress/docker-compose.yaml for that service;

version: '3.7'

networks:
  web:
    name: web 
    external: true
    attachable: true
  wordpress:
    name: wordpress

services:
  php:
    image: wordpress:latest
    expose:
      - 80
    environment:
      - WORDPRESS_DB_HOST=mariadb
      - WORDPRESS_DB_USER=db_user
      - WORDPRESS_DB_PASSWORD=db_pass
      - WORDPRESS_DB_NAME=wordpress
    volumes:
      - wordpress:/var/www/html
    labels:
      - traefik.enable=true
      - traefik.http.routers.wordpress.rule=Host(`wp.homenet.sprig.gs`)
      - traefik.http.routers.wordpress.tls.certresolver=letsencrypt
    depends_on:
      - mariadb
    networks:
      - wordpress
      - web 

  mariadb:
    image: mariadb:10.3
    environment:
      MYSQL_ROOT_PASSWORD: True
      MYSQL_USER: db_user
      MYSQL_PASSWORD: db_pass
      MYSQL_DATABASE: wordpress
    volumes:
      - db:/var/lib/mysql
    networks:
      - wordpress

volumes:
  wordpress:
  db:

And then we start it up;

alpine-docker:/opt/docker/wordpress# docker compose up -d
[+] Running 3/3
 ✔ Network wordpress              Created   0.2s 
 ✔ Container wordpress-mariadb-1  Started   3.0s 
 ✔ Container wordpress-php-1      Started   3.8s 
alpine-docker:/opt/docker/wordpress# 

Tada!

One final comment – I never did work out how to make connections forceably upgrade from HTTP to HTTPS, so instead, I shut down port 80 in Traefik, and instead run this container.

Featured image is “Traffic” by “Make Lemons” on Flickr and is released under a CC-BY-SA license.

An open padlock with a key inserted into it, on a printed circuit board

Pulling container images from private registries (including Docker Hub) with a Kubernetes Kubelet Credential Provider

At work last week, I finally solved an issue by writing some code, and I wanted to explain why I wrote it.

At it’s core, Kubernetes is an orchestrator which runs “Container Images”, which are structured filesystem snapshots, taken after running individual commands against a base system. These container images are stored in a container registry, and the most well known of these is the Docker registry, known as Docker Hub.

A registry can be public, meaning you don’t need credentials to get any images from it, or private. Some also offer a mixed-mode where you can make a certain number of requests without requiring authentication, but if you need more than that amount of requests, you need to provide credentials.

During the build-out of a new cluster, I discovered that the ECR (Elastic Container Registry) from AWS requires a new type of authentication – the Kubelet Credential Provider, which required the following changes:

  1. In /etc/sysconfig/kubelet you provide these two switches;
    --image-credential-provider-bin-dir /usr/local/bin/image-credential-provider and --image-credential-provider-config /etc/kubernetes/image-credential-provider-config.json.
  2. In /etc/kubernetes/image-credential-provider-config.json you provide a list of registries and the credential provider to use, which looks like this:
{
  "apiVersion": "kubelet.config.k8s.io/v1",
  "kind": "CredentialProviderConfig",
  "providers": [
    {
      "name": "binary-credential-provider-name",
      "matchImages": [
        "example.org",
        "registry.*.example.org",
        "*.registry.*.example.org"
      ],
      "defaultCacheDuration": "12h",
      "apiVersion": "credentialprovider.kubelet.k8s.io/v1"
    }
  ]
}
  1. Downloading and placing the credential provider binary into the /usr/local/bin/image-credential-provider path.

The ECR Credential Provider has it’s own Github repostitory, and it made me think – we’ve been using the “old” method of storing credentials using the containerd configuration file, which is now marked as deprecated – but this means that any changes to these credentials would require a restart of the containerd service (which apparently used to have a big impact on the platform), but this new ECR provider doesn’t.

I decided to write my own Credential Provider, following the documentation for the Kubelet Credential Provider API and I wrote it in Python – a language I’m trying to get better in! (Pull requests, feature requests, etc. are all welcome!)

I will confess I made heavy use of ChatGPT to get a steer on certain aspects of how to write the code, but all the code is generic and there’s nothing proprietary in this code.

Using the Generic Credential Provider

  1. Follow the steps above – change your Kubernetes environment to ensure you have the kubelet configuration changes and the JSON credential provider configuration put in the relevant parts of your tree. Set the “matchImages” values to include the registry in question – for dockerhub, I’d probably use ["docker.io", "*.docker.io"]
  2. Download the generic-credential-provider script from Github, put it in the right path in your worker node’s filesystem (if you followed my notes above it’ll be in /usr/local/bin/image-credential-provider/generic-credential-provider but this is *your* system we’re talking about, not mine! You know your build better than I do!)
  3. Create the /etc/kubernetes/registries directory – this can be changed by editing the script to use a new path, and for testing purposes there is a flag --credroot /some/new/path but that doesn’t work for the kubelet configuration file.
  4. Create a credential file, for example, /etc/kubernetes/registries/example.org.json which contains this string: {"username":"token_username","password":"token_password"}. [Yes, it’s a plaintext credential. Make sure it’s scoped for only image downloads. No, this still isn’t very good. But how else would you do this?! (Pull requests are welcomed!)] You can add a duration value into that JSON dictionary, to change the default timeout from 5 minutes. Technically, the default is actually set in /etc/kubernetes/image-credential-provider-config.json but I wanted to have my own per-credential, and as these values are coming from the filesystem, and therefore has very little performance liability, I didn’t want to have a large delay in the cache.
  5. Test your credential! This code is what I used:
echo '{
  "apiVersion": "credentialprovider.kubelet.k8s.io/v1",
  "kind": "CredentialProviderRequest",
  "image": "your.registry.example.org/org/image:version"
}' | /usr/local/bin/image-credential-provider/generic-credential-provider

which should return:

'{"kind": "CredentialProviderResponse", "apiVersion": "credentialprovider.kubelet.k8s.io/v1", "cacheKeyType": "Registry", "cacheDuration": "0h5m0s", "auth": {"your.registry.example.com": {"username": "token_username", "password": "token_password"}}}'

You should also see an entry in your syslog service showing a line that says “Credential request fulfilled for your.registry.example.com” and if you pass it a check that it fails, it should say “Failed to fulfill credential request for failure.example.org“.

If this helped you, please consider buying me a drink to say thanks!

Featured image is “Padlock on computer parts” by “Marco Verch Professional Photographer” on Flickr and is released under a CC-BY license.

A medieval helm in gold on a bench at a museum

Fixing 403 errors from ghcr.io with #helm pull

At work, I’m using skaffold to deploy a helm chart which references a ghcr.io repository. Here’s the stanza I’m looking at:

apiVersion: skaffold/v3
kind: Config
deploy:
  helm:
    releases:
      - name: {package}
        remoteChart: oci://ghcr.io/{owner}/{package}

This is the first time I’ve tried to deploy this chart, and I kept getting this message:

No tags generated
Starting test...
Starting deploy...
Helm release {package} not installed. Installing...
Error: INSTALLATION FAILED: failed to authorize: failed to fetch anonymous token: unexpected status from GET request to https://ghcr.io/token?scope=repository%3A{owner}%2F{package}%3Apull&scope=repository%3Auser%2Fimage%3Apull&service=ghcr.io: 403 Forbidden
deploying "{package}": install: exit status 1

I thought this might have been an issue with the skaffold file, so I tried running this directly with helm:

$ helm pull oci://ghcr.io/{owner}/{package}
Error: failed to authorize: failed to fetch anonymous token: unexpected status from GET request to https://ghcr.io/token?scope=repository%3A{owner}%2F{package}%3Apull&scope=repository%3Auser%2Fimage%3Apull&service=ghcr.io: 403 Forbidden

Huh, that looks a bit familiar. I spent a little while checking to see whether this was something at the Kubernetes cluster, or if it was just me, and ended up finding this nugget (thanks to a steer from this post)

$ gh auth token | helm registry login ghcr.io -u {my_github_user} --password-stdin
Login Succeeded

And now it works!

elm pull oci://ghcr.io/{owner}/{package}
Pulled: ghcr.io/{owner}/{package}:1.2.3
Digest: sha256:decafbad1234567890aabbccddeeffdeadbeefbadbadbadbad12345678901234

Featured image is “helm” by “23 dingen voor musea” on Flickr and is released under a CC-BY-SA license.

A text dialogue from a web page showing "Uh oh. Something really just went wrong. Good thing we know about it and have our crack team of squirrels getting their nuts out of the system!"

How to capture stdout and stderr from a command in a shellscript without preventing piped processes from seeing them

I love the tee command – it captures stdout [1] and puts it in a file, while then returning that output to stdout for the next process in a pipe to consume, for example:

$ ls -l | tee /tmp/output
total 1
xrwxrwxrw 1 jonspriggs jonspriggs 0 Jul 27 11:16 build.sh
$ cat /tmp/output
total 1
xrwxrwxrw 1 jonspriggs jonspriggs 0 Jul 27 11:16 build.sh

But wait, why is that useful? Well, in a script, you don’t always want to see the content scrolling past, but in the case of a problem, you might need to catch up with the logs afterwards. Alternatively, you might do something like this:

if some_process | tee /tmp/output | grep -q "some text"
then
  echo "Found 'some text' - full output:"
  cat /tmp/output
fi

This works great for stdout but what about stderr [2]? In this case you could just do:

some_process 2>&1 | tee /tmp/output

But that mashes all of stdout and stderr into the same blob.

In my case, I want to capture all the output (stdout and stderr) of a given process into a file. Only stdout is forwarded to the next process, but I still wanted to have the option to see stderr as well during processing. Enter process substitution.

TEMP_DATA_PATH="$(mktemp -d)"
capture_out() {
  base="${TEMP_DATA_PATH}/${1}"
  mkdir "${base}"
  shift
  "$@" 2> >(tee "${base}/stderr" >&2) 1> >(tee "${base}/stdout")
}

With this, I run capture_out step-1 do_a_thing and then in /tmp/tmp.sometext/step-1/stdout and /tmp/tmp.sometext/step-1/stderr are the full outputs I need… but wait, I can also do:

$ capture_out step-1 do_a_thing | \
  capture_out step-2 process --the --thing && \
  capture_out step-3 echo "..." | capture_out step-4 profit
$ find /tmp/tmp.sometext -type f
/tmp/tmp.sometext/step-1/stdout
/tmp/tmp.sometext/step-1/stderr
/tmp/tmp.sometext/step-2/stdout
/tmp/tmp.sometext/step-2/stderr
/tmp/tmp.sometext/step-4/stdout
/tmp/tmp.sometext/step-4/stderr
/tmp/tmp.sometext/step-3/stderr
/tmp/tmp.sometext/step-3/stdout

Or

if capture_out has_an_error something-wrong | capture_out handler check_output
then
  echo "It all went great"
else
  echo "Process failure"
  echo "--Initial process"
  # Use wc -c to check the number of characters in the file
  if [ -e "${TEMP_DATA_PATH}/has_an_error/stdout"] && [ 0 -ne "$(wc -c "${TEMP_DATA_PATH}/has_an_error/stdout")" ]
  then
    echo "----stdout:"
    cat "${TEMP_DATA_PATH}/has_an_error/stdout"
  fi
  if [ -e "${TEMP_DATA_PATH}/has_an_error/stderr"] && [ 0 -ne "$(wc -c "${TEMP_DATA_PATH}/has_an_error/stderr")" ]
  then
    echo "----stderr:"
    cat "${TEMP_DATA_PATH}/has_an_error/stderr"
  fi
  echo "--Second stage"
  if [ -e "${TEMP_DATA_PATH}/handler/stdout"] && [ 0 -ne "$(wc -c "${TEMP_DATA_PATH}/handler/stdout")" ]
  then
    echo "----stdout:"
    cat "${TEMP_DATA_PATH}/handler/stdout"
  fi
  if [ -e "${TEMP_DATA_PATH}/handler/stderr"] && [ 0 -ne "$(wc -c "${TEMP_DATA_PATH}/handler/stderr")" ]
  then
    echo "----stderr:"
    cat "${TEMP_DATA_PATH}/handler/stderr"
  fi
fi

This has become part of my normal toolkit now for logging processes. Thanks bash!

Also, thanks to ChatGPT for helping me find this structure that I’d seen before, but couldn’t remember how to do it! (it almost got it right too! Remember kids, don’t *trust* what ChatGPT gives you, use it as a research starting point, test *that* against your own knowledge, test *that* against your environment and test *that* against expected error cases too! Copy & Paste is not the best idea with AI generated code!)

Footnotes

[1] stdout is the name of the normal output text we see in a shell, it’s also sometimes referred to as “file descriptor 1” or “fd1”. You can also output to &1 with >&1 which means “send to fd1”

[2] stderr is the name of the output in a shell when an error occurs. It isn’t caught by things like some_process > /dev/null which makes it useful when you don’t want to see output, just errors. Like stdout, it’s also referred to as “file descriptor 2” or “fd2” and you can output to &2 with >&2 if you want to send stdout to stderr.

Featured image is “WordPress Error” by “tara hunt” on Flickr and is released under a CC-BY-SA license.

Tools I use when writing documentation

I’ve just finished what felt like the worlds longest work instruction, and it made me think… I’ve got these great tools at my disposal for when I’m writing documentation – perhaps not everyone knows about them!?

So here are the main ones!

Open Broadcaster Software (OBS) Studio

OBS Studio is a screen recording application, most commonly used by eSports players and gamers to stream content to streaming platforms like Twitch. While it’s really easy to do stuff like “lower third” bars (like this)

It’s also really *really* easy to just record a screen, which makes it easy to just “set and forget” and then run through the tasks. In the past, I’ve been on highly-technical in-person training courses and run OBS while I’ve been in a room, just to make sure I didn’t miss any details when I went back over my notes later!

Clicking “Start Recording” in the bottom third of that screen starts writing the content of that screen into (by default) a MKV file in your home directory (on Linux), or into your Videos directory on Windows. I don’t recall where it went on OS X!

This means after the task is done, I can play it back with…

VideoLan Client (VLC)

VLC is (or, at least, was) the defacto video player for anyone who consumes media on their computer. In my case, I only really use it now for playing back files I’ve recorded with OBS, but it’s a great player.

I only really make one key change to VLC, which is; adding the playback speed buttons. Different platforms do it differently, but on Linux and Windows at least, go to Tools -> Customise Interface and you’re presented with a screen like this:

I drag the “Slower” and “Faster” buttons to either side of the stop button, and will typically play videos back at 3x or even 8x speed to get to the areas I want, and then slow it down, sometimes, to 0.5x speed to get specific frames I’m looking for.

Once I get that frame, I’ll use a…

Screen Snipping Tool

On Windows this is the built-in snipping tool, found by pressing Windows+Shift+S. On Ubuntu, I’ve installed the package gnome-screenshot and the Gnome Extension Screenshot Tool.

With Snipping Tool you can draw circles around things and make annotations with a pen, but in extreme cases, I rely on the …

GNU Image Manipulation Program (GIMP).

GIMP, aside from being a badly named project (notably because most people over a certain age know about that scene from Pulp Fiction) is a FANTASTIC image editor. I use it for all sorts of editing, cropping and resizing, but I particularly love the layers menu on the side.

A couple of years ago my son wanted to give all his friends “membership cards” for a club he’d made. These were created in GIMP and just required him to clone a layer from the block on the right, hide the previous layer, and change the text in the clone.

This also means that if you want to easily highlight specific areas of the screen it’s only a few clicks to do it. Now, that said, it’s not as straightforward as Paint, and for anything beyond easy tweaks it will take a bit of experience, but it works.

This is all well and good, but sometimes you just need details from a terminal, where I’d use…

Asciinema

I use Asciinema (just a pip, apt or rpm away) when I’m working on something on a command line that I want to play back as a video, and the main reason is that I can adjust my output really quickly and easily!

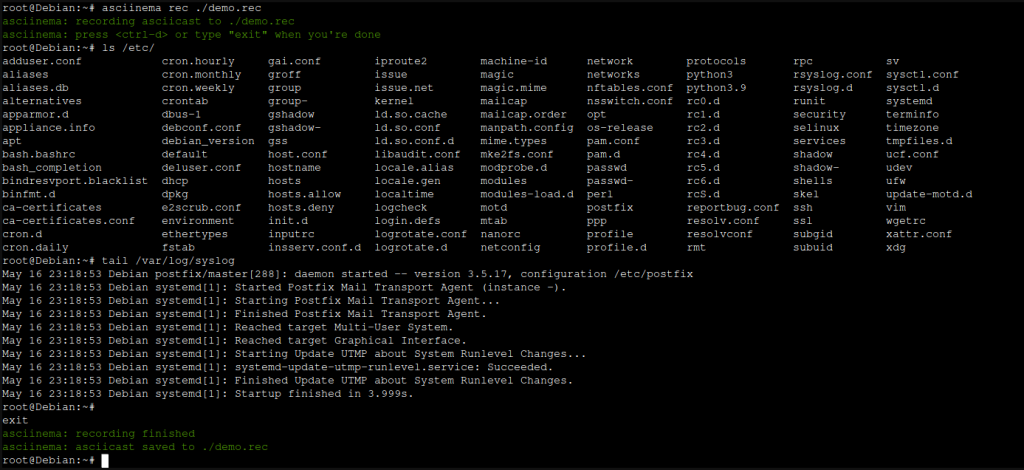
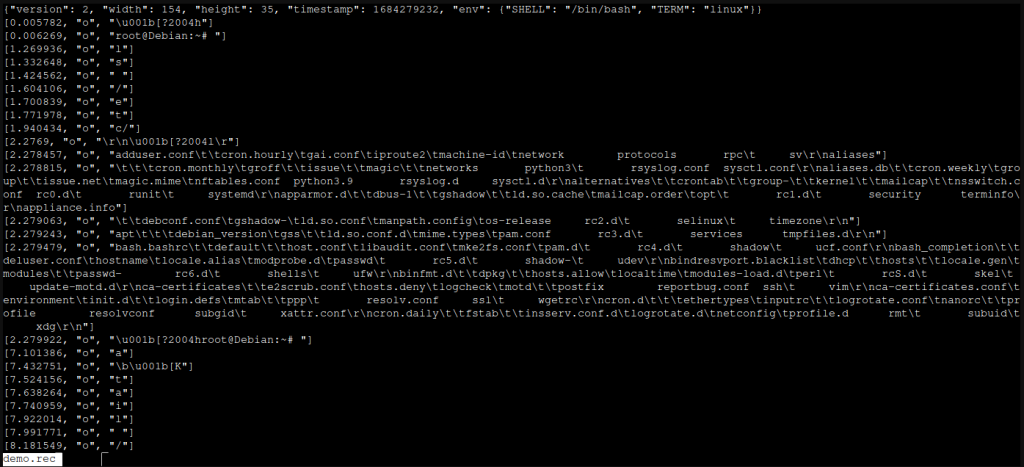
Consider this screen of data:

I “recorded” that using asciinema rec ./demo.rec and ended it with ctrl+d. That created a file called demo.rec, which looks like this:

Each line is prefixed with a timestamp, it then has a stream action (mostly o for “output”, but you can add m for “marker” or i for “input” in there if you wanted to be clever ;) ) and then the text which will be rendered when it’s played back (more about that in a tic). This means that if you make a drastic typo, you can fix it in this file, or if you want to redact a password that you never meant to type, you can do!

But, and here’s the next awesome thing, you can also ask it to play back ignoring any gaps longer than X amount of fractions of a second, so if you went off to make a coffee in the middle of doing a recording, playback won’t show it.

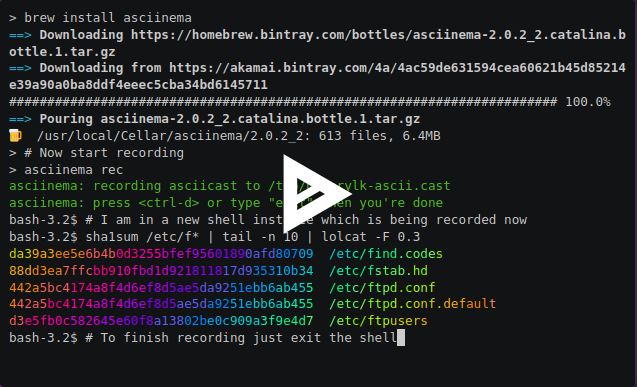
And then, playing it back… well, you can just run asciinema play demo.rec but that’s a bit boring… but you can link to it, like this demo I created a while ago or even embed it in your own site

Rendering it all

And the last thing I use? Whatever writing tool I have to hand! I typically write on my blog if it’s for public consumption (like this), but I’ve used private Github and gitlab repos, Visual Studio Code to create markdown files, Google Docs, Microsoft Word, LibreOffice Writer and even slide decks if it’s the right tool for the job.

But the most important thing is that you get your documentation OUT THERE! It’s so frustrating only having half a story… like this one:

This is an XKCD Comic titled "Wisdom of the Ancients" which has the alt-text:
"All long help threads should have a sticky globally-editable post at the top saying 'DEAR PEOPLE FROM THE FUTURE: Here's what we've figured out so far ...'"

It depicts a stick figure shaking his screen, and a series of lines of text which say:
"Never have I felt so close to another soul and yet so helplessly alone as when I Google an erorr and there's one result a thread by someone with the same problem and no answer last posted to in 2003"

Above the stick figure is the text "Who were you DenverCoder9? What did you see?!"

Featured image is “Tools” by “Paul Downey” on Flickr and is released under a CC-BY license.

Using multiple GitHub accounts from the Command Line with Environment Variables (using `direnv`) and per-account SSH keys

I recently was in the situation where I had two github profiles (one work, one personal) that I needed to incorporate in projects.

My work account on this device is my “default”, I use it to push, pull and so on, but the occasional personal activities (like terminate-notice) all should be attributed to my personal account.

To make this happen, I used direnv which reads a .envrcfile in the parents of the directory you’re currently in. I created a directory for my personal projects – ~/Code/Personaland placed a .envrc file which contains:

export GIT_AUTHOR_EMAIL=jon@sprig.gs
export GIT_COMMITTER_EMAIL=jon@sprig.gs
export GIT_SSH_COMMAND="ssh -i ~/.ssh/personal.id_ed25519"
export SSH_AUTH_SOCK=

This means that I have a specific SSH key just for my personal activities (~/.ssh/personal.id_ed25519) and I’ve got my email address defined as two environment variables – AUTHOR (who wrote the code) and COMMITTER (who added it to the tree) – both are required when you’re changing them like this!

Because I don’t ever want it to try to use my SSH Agent, I’ve added the fact that SSH_AUTH_SOCK should be empty.

As an aside, work also require Commit Signing, but I don’t want to use that for my personal projects right now, so I also discovered a new feature as-of 2020 – the environment variables GIT_CONFIG_KEY_x, GIT_CONFIG_VALUE_x and GIT_CONFIG_COUNT=x

By using these, you can override any system, global and repo-level configuration values, like this:

export GIT_CONFIG_KEY_0=commit.gpgSign
export GIT_CONFIG_VALUE_0=false
export GIT_CONFIG_KEY_1=push.gpgSign
export GIT_CONFIG_VALUE_1=false
export GIT_CONFIG_KEY_2=tag.gpgSign
export GIT_CONFIG_VALUE_2=false
export GIT_CONFIG_COUNT=2

This ensures that I *will not* GPG Sign commits, tags or pushes.

If I accidentally cloned a repo into an unusual location, or on purpose need to make a directory or submodule a personal repo, I just copy the .envrc file into that part of the tree, run direnv allowand hey-presto! I’ve turned that area into a personal repo, without having to remember the .gitconfigstring to mark a new part of my tree as a personal one.

The direnv and SSH part was largely inspired by : Handle multiple github accounts while the GIT_CONFIG_* bit was found via this StackOverflow answer.

Featured image is “Mirrored Lotus” by “Faye Mozingo” on Flickr and is released under a CC-BY-SA license.